
Battery Degradation
Battery degradation is the permanent loss of energy-storage capacity or power capability caused by time, temperature, and use.
In an EV, degradation can appear as:
- Less usable energy and driving range
- Higher internal resistance
- More heat generated under load
- Reduced charging or regenerative-braking power
- Lower peak or sustained drive power
- One weak cell group limiting the rest of the pack
All rechargeable EV batteries degrade at rates shaped by chemistry, electrode design, battery temperature, state of charge, charging power, pack cooling, software limits, and vehicle use; this permanent loss should not be confused with temporary winter range loss or a battery-system fault.
What Battery Degradation Changes
Battery health is often reduced to remaining capacity. That is important, but it is not the complete picture.
Two batteries with the same measured capacity retention can behave differently if one has developed substantially higher internal resistance.
Capacity Fade
Capacity fade means that the battery stores less usable energy than when it was new.
For example, if a battery originally delivered 80 kWh across its usable operating window and later delivers 72 kWh under comparable test conditions, its measured usable capacity has fallen by 10%.
Capacity retention =
Current measured capacity ÷ Reference capacity when new
Capacity retention =
72 kWh ÷ 80 kWh
= 90%
Less usable energy can reduce driving range, although the actual range change also depends on vehicle efficiency, weather, tyres, speed, and route.
Resistance Growth and Power Fade
Internal resistance normally increases as a battery ages.
Higher resistance causes:
- A larger voltage drop during acceleration
- A larger voltage rise during charging
- More heat generation
- Earlier arrival at cell-voltage limits
- Lower charging power
- Less regenerative-braking capability
- Reduced peak or sustained drive power
The relationship between current, resistance, and resistive heat is approximately:
Resistive heat ∝ Current² × Resistance
A battery can therefore retain much of its original energy capacity while becoming less capable of accepting or delivering high power.
Manufacturers often include sufficient power margin that moderate resistance growth is not immediately noticeable. Capacity loss may become visible through reduced range before the driver notices power fade.
Charge-Power Fade
A degraded battery may need to reduce charging current earlier because increased resistance causes cell voltage and temperature to rise more quickly.
Possible effects include:
- Lower peak DC charging power
- Earlier charging taper
- Longer charging time
- More active cooling
- Greater sensitivity to cold temperature
- Less repeatable charging over several stops
A slower charging session does not prove that the battery has degraded. Charger capability, battery temperature, arrival SOC, power sharing, and preconditioning must also be considered.
Cell Imbalance
Battery packs are limited by the first monitored cell group to reach its upper or lower voltage limit.
If one group has lost more capacity or developed higher resistance than the others, it may:
- Reach full voltage early during charging
- Reach minimum voltage early during discharge
- Reduce usable pack energy
- Cause charging to taper sooner
- Limit drive power near empty
Cell balancing can correct differences in charge level, but it cannot restore capacity that a degraded group has permanently lost.
Temporary Range Loss Is Not Degradation
Driving range can change substantially without any permanent battery damage.
Temporary range loss can be caused by:
- Low battery temperature
- Cabin heating
- Wet, snowy, or cold roads
- Winter tyres
- Strong wind
- Higher motorway speed
- Roof racks or roof boxes
- Towing
- Changed driving style
- An inaccurate range estimate
- A recent BMS recalibration
A cold battery has higher resistance and may reach its lower voltage limit earlier under load. Some of the stored energy can become more accessible after the cells warm or after the battery rests.
Permanent degradation remains after temperature, load, and SOC-estimation effects have been accounted for.
This is why the range displayed after charging is not a reliable battery-health measurement. The range estimator may be reacting to recent consumption rather than measuring battery capacity.
Calendar Ageing
Calendar ageing occurs with time, including while the vehicle is parked.
The battery does not need to complete charging cycles for chemical ageing reactions to continue.
Calendar ageing is strongly influenced by:
- Time
- Cell temperature
- State of Charge
- Cell voltage
- Battery chemistry
- Electrode and electrolyte design
High temperature increases the speed of unwanted chemical reactions. High SOC places many lithium-ion chemistries at a more stressful cell voltage. The combination of heat and prolonged high SOC is therefore particularly demanding.
This does not mean that occasionally charging to 100% is necessarily harmful. The more important distinction is between briefly reaching a high SOC before a journey and leaving the vehicle parked near full for days or weeks.
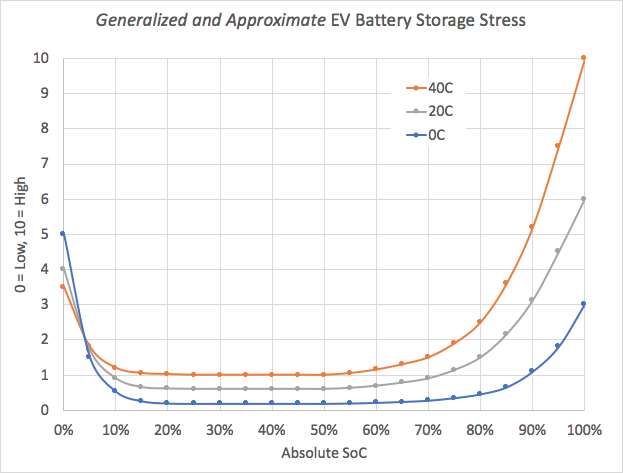
Battery storage stress at different temperatures and states of charge
Calendar ageing can result in:
- Loss of usable lithium
- Electrolyte decomposition
- Growth of surface layers
- Increased internal resistance
- Gas generation
- Reduced energy capacity
- Lower charge and discharge power
Calendar and cycle ageing are useful classifications, but they are not completely separate. Many of the same chemical reactions occur during both, and cycling can create conditions that continue to cause ageing after the current has stopped.
Cycle Ageing
Cycle ageing is degradation associated with charging and discharging.
Every time energy moves through the battery, the electrodes expand and contract, ions move through the cell, and some energy is lost as heat. Small unwanted reactions also occur.
The effect depends on more than the number of times the charging cable is connected.
Important factors include:
- Total energy throughput
- Depth of Discharge
- Average SOC
- Charging C-rate
- Discharge power
- Battery temperature
- Cell chemistry
- Time spent resting between cycles
A shallow cycle under moderate conditions is not equivalent to a deep, high-power cycle at an unfavourable temperature.
Equivalent Full Cycles
One charging session does not equal one battery cycle.
An Equivalent Full Cycle, or EFC, represents cumulative energy throughput equal to 100% of the battery’s usable capacity.
Examples:
- Two 50-percentage-point cycles equal approximately one EFC
- Four 25-percentage-point cycles equal approximately one EFC
- Five cycles using 20% of capacity equal approximately one EFC
Regenerative braking also contributes to charge throughput.
Geotab uses the same cumulative concept in its fleet analysis: repeatedly using and replacing 25% of capacity four times represents one complete equivalent cycle. (Geotab)
This makes EFC more useful than simply counting charging sessions.
Depth of Discharge and Average SOC
Depth of Discharge and average SOC describe different kinds of stress.
Depth of Discharge
Depth of Discharge describes how much of the battery window is used during a cycle.
Examples:
- 70% to 50% is a 20-percentage-point cycle
- 80% to 30% is a 50-percentage-point cycle
- 100% to 10% is a 90-percentage-point cycle
Repeated deep cycling can create more mechanical and electrochemical stress than shallow cycling, although the exact relationship depends on the chemistry and operating window.
Average SOC
Two cycles can have the same depth but take place at different average charge levels:
- 20% to 70%
- 50% to 100%
Both use 50 percentage points, but the second cycle spends more time at high cell voltage.
The higher average SOC can increase calendar stress even though the depth is identical.
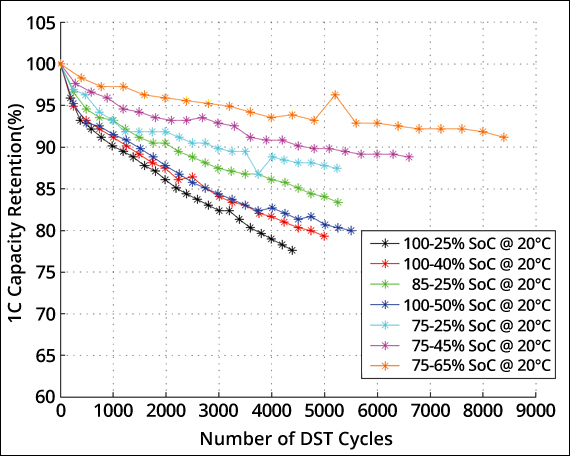
Battery cycle stress at different states of charge
Do EVs Need to Stay Between 20% and 80%?
The widely repeated 20–80% rule is too simplistic.
Geotab’s updated fleet analysis found little difference between vehicles with low and moderate exposure to SOC below 20% or above 80%. A clearer increase appeared only in the group that spent more than 80% of its total time at those extremes. That high-exposure group averaged 2.0% annual degradation, compared with 1.4–1.5% in the lower-exposure groups. (Geotab)
This does not mean that SOC has no effect. It suggests that prolonged time near full or empty matters more than occasionally using those parts of the battery.
For most owners:
- Using 100% before a long journey is normal
- Arriving home or at a charger with low SOC is normal
- Leaving the vehicle near full for an extended period is less desirable
- Leaving it nearly empty for an extended period should be avoided
- Manufacturer-specific charging guidance takes priority over generic rules
Some LFP vehicles are also instructed to charge fully at defined intervals so the BMS can calibrate SOC accurately.
What Changes Inside the Cell
Battery degradation is not one single reaction. Several mechanisms can occur simultaneously.
Loss of Lithium Inventory
Some lithium becomes trapped in side-reaction products and is no longer available for normal movement between the electrodes.
A major contributor is growth of the Solid Electrolyte Interphase, or SEI, on the negative electrode.
The SEI is necessary because it protects the electrode from continued electrolyte decomposition while still allowing lithium ions to pass. However, forming and growing the layer consumes active lithium and electrolyte.
Laboratory and diagnostic studies identify loss of lithium inventory through SEI growth as a major source of early capacity fade, followed in some cells by increasing loss of active material. (US Department of Energy)
As the SEI becomes thicker or damaged, it can also increase internal resistance.
Loss of Active Material
Parts of an electrode can stop participating in the battery reaction.
Possible causes include:
- Particle cracking
- Structural phase changes
- Electrode delamination
- Loss of electrical contact
- Binder deterioration
- Dissolution of active material
- Blocked ion pathways
The active material can still be physically present inside the cell but no longer connected well enough to store and release ions.
Research into battery ageing identifies both loss of lithium inventory and loss of active material as important contributors to capacity and power fade. (US Department of Energy)
Electrolyte Degradation
The electrolyte is not perfectly stable across the complete cell-voltage and temperature range.
It can react with the electrodes, particularly at:
- High cell voltage
- Elevated temperature
- Damaged electrode surfaces
- High charging current
- Contaminated or defective areas
Electrolyte decomposition can contribute to:
- Gas formation
- Resistance growth
- Loss of lithium
- Surface-film growth
- Reduced ion conductivity
- Dry areas within the electrode structure
The electrolyte and electrode interfaces are closely connected. Damage to one component can accelerate degradation elsewhere in the cell.
Lithium Plating
During charging, lithium ions should move into the structure of the negative electrode.
If lithium reaches a graphite-based anode faster than it can be inserted, metallic lithium can deposit on the surface.
Lithium plating is more likely when:
- The cell is cold
- Charging current is high
- SOC is high
- The negative electrode is thick
- Internal resistance has increased
- Ion pathways are uneven
- The cell has manufacturing defects
DOE research identifies high charge rate, low temperature, and high electrode loading as important plating conditions. Deposited lithium can cause capacity loss, increased resistance, and potentially an internal short circuit. (US Department of Energy)
Some plated lithium may be reversible, but part of it can lose electrical contact and become inactive dead lithium. A normal discharge does not necessarily restore it.
This is why a cold EV may sharply restrict DC charging and regenerative braking until the battery has warmed.
Mechanical Damage and Silicon Expansion
Electrode materials change volume as ions enter and leave them.
Graphite handles this movement relatively well. Silicon can store much more lithium but expands far more during charging.
Repeated expansion can:
- Crack silicon particles
- Damage the electrode coating
- Break electrical connections
- Disrupt the SEI
- Expose fresh surfaces
- Consume additional electrolyte and lithium
- Increase cell swelling
Silicon-graphite and silicon-dominant anodes therefore require carefully engineered particles, binders, electrolyte additives, porosity, and pressure control.
Calendar and Cycle Ageing Interact
Calendar ageing continues during driving and charging, while cycling changes the conditions under which calendar-type reactions occur.
For example:
- Fast charging raises temperature
- High SOC after charging increases voltage-related stress
- Driving can warm the pack before it is parked
- Cracked particles expose new surfaces that react while the vehicle rests
- SEI growth raises resistance, creating more heat during later cycles
It is therefore not possible to assign every percentage point of degradation neatly to either time or cycling.
The distinction remains useful because it explains why both low-mileage older EVs and high-mileage newer EVs can show measurable degradation for different reasons.
Temperature and Degradation
Temperature affects nearly every ageing mechanism.
High Temperature
Heat accelerates chemical reactions inside the cell.
Prolonged high temperature can increase:
- SEI growth
- Electrolyte decomposition
- Gas generation
- Transition-metal dissolution
- Calendar ageing
- Resistance growth
Geotab’s latest fleet data found vehicles in its hot-climate group degraded an average of 0.4 percentage points faster per year than vehicles in milder conditions. The study defined the groups according to the share of days above 25°C and could not isolate consistently cold climates in the same way. (Geotab)
Active cooling reduces the effect, but it cannot remove every temperature difference between climates and usage patterns.
Low Temperature
Cold storage is generally not equivalent to hot storage. Low temperature slows many ageing reactions.
The main concern is charging a cold graphite-based cell too aggressively.
At low temperature:
- Ion movement slows
- Internal resistance increases
- Graphite accepts lithium more slowly
- Cell voltage rises more quickly during charging
- Lithium-plating risk increases
The BMS should restrict charging current or heat the battery before permitting high power.
Cold-weather charging stress therefore depends heavily on preconditioning, thermal management, and charging software.
Fast Charging and Degradation
DC fast charging is a normal design use of a modern EV. The battery and BMS are built to accept it within defined limits.
The degradation effect depends on much more than the number printed on the charger:
- Actual battery power
- Battery capacity
- Charging C-rate
- Battery temperature
- Arrival SOC
- Charging curve
- Cell design
- Cooling performance
- How often high power is used
A 150 kW charge represents approximately:
- 1C for a 150 kWh battery
- 2C for a 75 kWh battery
- 3C for a 50 kWh battery
The same charger power therefore does not create the same cell-level stress in every vehicle.
Real-World Fast-Charging Data
Geotab divided more than 22,700 EVs into charging-use cohorts. Vehicles where DC charging represented less than 12% of charging sessions averaged 1.5% annual degradation. Vehicles using DC charging more frequently averaged 2.5%. (Geotab)
Among the frequent-DC group, charging power also mattered:
| Charging-use group | Definition | Average annual degradation |
|---|---|---|
| Low DC frequency | DC charging below 12% of all charging sessions | 1.5% |
| High-frequency, lower-power DC | DC charging above 12%; fewer than 40% of DC sessions above 100 kW | 2.2% |
| High-frequency, high-power DC | DC charging above 12%; more than 40% of DC sessions above 100 kW | 3.0% |
These are aggregated cohort averages, not predictions for a particular vehicle. Geotab anonymised the models and did not isolate chemistry, pack size, cooling design, climate, and charging curve into controlled laboratory variables. The results nevertheless show a clear association between frequent high-power charging and faster capacity loss across the dataset. (Geotab)
The practical conclusion is not that owners should avoid DC charging. Fast charging exists to make long journeys and intensive use possible.
Use it when it provides practical value. Slower charging is preferable when the car is already parked for several hours and rapid charging offers no benefit.
High-Power Driving and Regeneration
High discharge power also creates heat and mechanical stress, but its effect depends on duration and thermal control.
Short acceleration bursts are usually less demanding than:
- Sustained high-speed driving
- Long mountain climbs
- Towing
- Track use
- Repeated full-power acceleration
Regenerative braking adds charging throughput. The BMS limits regeneration when temperature, SOC, voltage, or power capability make high charging current unsuitable.
For most private owners, normal acceleration and regenerative braking are unlikely to dominate battery ageing. Time, temperature, SOC exposure, and charging pattern are usually more significant.
Differences Between Cell Chemistries
Named chemistry does not determine degradation by itself, but it changes the baseline trade-offs.
NMC, NCA, and NCMA
Nickel-based cells offer high energy density and strong power capability.
Their ageing can be sensitive to:
- High cell voltage
- High temperature
- High-nickel cathode stability
- Particle cracking
- Electrolyte oxidation
- Transition-metal dissolution
Manufacturers manage these stresses through coatings, electrolyte additives, voltage limits, cooling, and BMS calibration.
LFP
LFP generally offers:
- Long cycle life
- Strong thermal stability
- Good tolerance of frequent cycling
- Lower cathode-material cost
It is not immune to degradation.
LFP cells still experience:
- SEI growth
- Loss of active lithium
- Electrolyte ageing
- Resistance increase
- Cell imbalance
- Cold-charging limitations
Long-term storage at high SOC and high temperature can still create avoidable stress.
LFP’s flat voltage curve also makes SOC estimation more difficult, which can make apparent range or percentage changes look like degradation when the BMS is recalibrating.
Silicon-Containing Anodes
A higher silicon content can increase energy density, but it also creates more electrode expansion and repeated surface-film damage.
The degradation result depends heavily on:
- Silicon content
- Particle structure
- Binder
- Electrolyte additives
- Cell pressure
- Charging strategy
A battery advertised as using silicon does not automatically have poor durability. The implementation matters.
Sodium-Ion
Sodium-ion cells use different electrode materials and have different ageing mechanisms from lithium-ion cells.
Potential advantages in cost and temperature behaviour do not automatically translate into longer life. Long-term automotive field data remains limited compared with established lithium-ion chemistries.
Claims about sodium-ion durability should therefore be evaluated for the specific cell design rather than applied to the complete technology family.
Degradation Is Usually Not Linear
A battery does not necessarily lose the same percentage of capacity every year.
A typical curve may include:
- An initial settling period with relatively visible early loss
- A long period of gradual degradation
- A possible accelerated late-life region, sometimes called the knee
Not every EV battery develops a pronounced knee within the life of the vehicle.
Geotab observed that many newer vehicles in its data showed a sharper decline during the first year or two before stabilising. Eight of the 11 established models carried over from its earlier dataset averaged 1.4% annual degradation after their results had stabilised. (Geotab)
This is why multiplying an average annual percentage by the vehicle’s age is unreliable:
2.3% × 10 years ≠ a reliable prediction of 23% loss
The 2.3% figure is a cohort average, not a universal linear ageing law.
Degradation Is Not the Same as Battery Failure
A battery can degrade gradually without failing.
A battery-system failure can instead be caused by:
- A defective cell
- An internal cell short circuit
- Excessive self-discharge
- A failed contactor
- An isolation fault
- A coolant leak
- A faulty voltage or temperature sensor
- A damaged busbar
- A communication failure
- Collision or underbody damage
- A failed Battery Management System component
A pack can retain 95% of its energy capacity and still require repair because one electrical component has failed.
Another pack can operate normally with 80% remaining capacity but provide less driving range.
This distinction also matters for warranties. A defect warranty and a capacity-retention warranty do not necessarily cover the same conditions.
How Battery Health Is Measured
Measuring battery health accurately is more difficult than reading the dashboard range.
Common methods include:
- BMS-reported State of Health
- Controlled energy-discharge testing
- Manufacturer diagnostic procedures
- Workshop capacity tests
- Measuring energy across a known SOC interval
- Analysing cell-voltage spread and resistance
- Long-term telematics analysis
BMS-Reported State of Health
The BMS estimates battery health from data such as:
- Energy throughput
- Current integration
- Voltage behaviour
- Internal resistance
- Cell imbalance
- Temperature history
- Charging history
- Battery age
A displayed SOH percentage may represent capacity retention, power capability, or a proprietary combination.
SOH figures from different manufacturers are not necessarily comparable because they may use different:
- Reference capacities
- Buffers
- Temperature corrections
- Test methods
- Estimation models
- Definitions of “new”
Controlled Energy Test
A controlled capacity test measures energy delivered across a defined SOC window under known conditions.
For a useful comparison, the test should account for:
- Battery temperature
- Starting and ending SOC
- Vehicle auxiliary consumption
- Charging and discharge losses
- BMS calibration
- Whether the reference is gross or usable capacity
- Battery buffers
A workshop or built-in manufacturer test is usually more reliable than trying to infer degradation from one charging invoice.
Tesla Battery Health Test
Supported Tesla vehicles include a built-in Battery Health Test.
Tesla states that the vehicle must be connected to an AC charger and that the process can take up to 24 hours. The test may discharge the battery to 0%, then reports energy retention compared with when the battery was new. Tesla also notes that the displayed range may be recalibrated afterward. (Tesla)
Tesla recommends running the test only when there is a concern about battery energy retention.
This type of controlled process is fundamentally different from comparing the displayed range at 100% on two separate dates.
Why Displayed Range Is a Poor Health Test
Displayed full-charge range can change because of:
- Recent energy consumption
- Temperature
- Software updates
- BMS calibration
- Wheel and tyre configuration
- Driving mode
- Certification-value changes
- Battery degradation
Some vehicles show a fixed rated range derived from SOC, while others use a prediction based on recent driving.
A lower dashboard number is therefore not enough to diagnose battery degradation.
Real-World Battery Degradation Data
Large fleet datasets provide a useful view of real-world ageing, but they need careful interpretation.
Geotab 2026 Publication
Geotab’s updated 2026 publication is based on an analysis of more than 22,700 EVs across 21 anonymised models.
It reports:
- Average across all analysed vehicles: 2.3% per year
- Light passenger cars: 2.0% per year
- Multipurpose vehicles, including vans: 2.7% per year
- Stable carry-over models: 1.4% per year on average
- Hot-climate penalty: approximately 0.4 percentage points per year
- High-frequency, high-power DC cohort: 3.0% per year
- Low-DC-frequency cohort: 1.5% per year (Geotab)
Geotab’s previous analysis reported 1.8% per year. The increase to 2.3% does not prove that newer batteries are worse. Geotab attributes it to differences in vehicle mix, higher use, more powerful charging, and a greater number of newer vehicles still in their initial decline phase. (Geotab)
The limitations are important:
- Vehicle models are anonymised
- The data is strongly influenced by fleet use
- Battery chemistry is not isolated
- Thermal design and battery size differ
- Annual rates are cohort averages
- The figures should not be extrapolated as straight lines
The study is most useful for identifying trends, not predicting the exact health of one car.
Tesla Fleet Data
Tesla’s 2023 Impact Report states that Model 3 and Model Y batteries had lost about 15% of their original capacity on average after 200,000 miles.
This is manufacturer-reported fleet data rather than an independent controlled study. Tesla also notes that mileage is only one factor and that battery age affects retention. (Tesla)
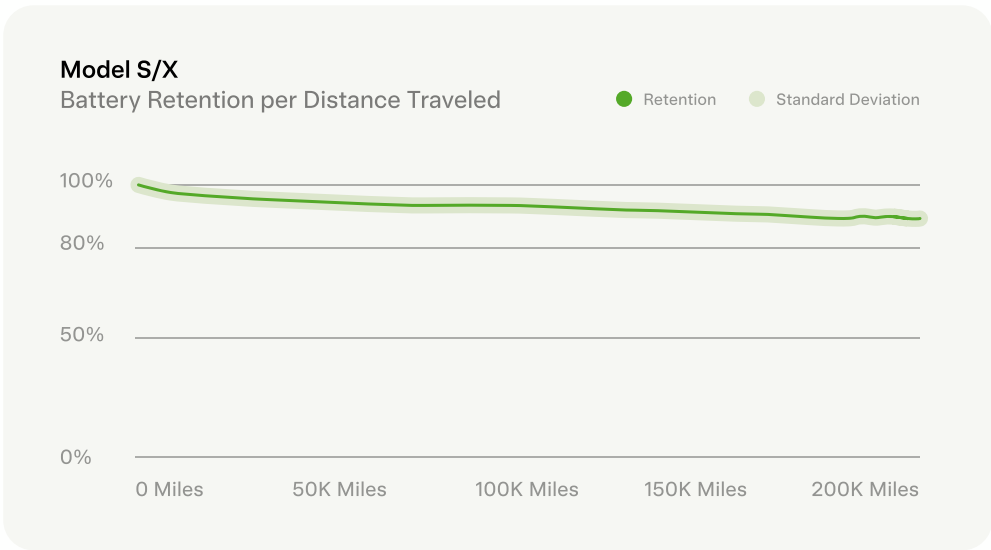
The data is still useful because it covers high-mileage production vehicles. It should not be assumed to represent every battery chemistry, factory, model year, climate, or use pattern.
What Degradation Means for a Used-EV Buyer
Battery health is one of the most important specifications on an older EV, but it should not be judged from age or odometer reading alone.
Useful information includes:
- Remaining usable capacity
- Manufacturer or independent SOH test
- Cell-voltage spread
- Internal-resistance trends
- Charging curve
- Battery and drivetrain warnings
- Warranty history
- Repair or module-replacement history
- Climate and usage history
- Whether the car can precondition and cool the battery correctly
A high-mileage vehicle with good thermal management and moderate battery stress can have a healthier pack than a lower-mileage vehicle stored at high SOC in a hot climate.
Questions Worth Asking
- Has the battery received a documented health test?
- Is the test based on measured energy or only a BMS estimate?
- Does the vehicle still reach its expected charging power when properly prepared?
- Are there unusual cell-voltage differences?
- Has the pack or any module been repaired?
- Does the warranty transfer to the next owner?
- What capacity threshold does the warranty use?
- Is the quoted capacity gross, usable, or current measured capacity?
A transparent battery-health certificate is far more useful than a dashboard photograph showing estimated range.
What Drivers Can Do
Battery degradation cannot be stopped, but unnecessary stress can be reduced.
Practical habits include:
- Follow the charging guidance for the specific vehicle
- Avoid leaving the battery near full for long periods when the range is not needed
- Avoid storing the vehicle nearly empty
- Precondition before high-power charging in cold weather
- Use DC fast charging when it provides practical value
- Prefer AC or lower-power charging when the car will already be parked for hours
- Avoid unnecessary prolonged heat exposure when practical
- Leave the battery at a moderate SOC during long-term storage
- Keep thermal-management and charging software updated
- Do not obsess over occasional full charges or normal road-trip fast charging
Owners should use the battery to make the vehicle useful. Avoiding every high SOC, deep discharge, or fast charge can create more inconvenience than meaningful battery-life benefit.
For practical ownership advice, see How to Extend EV Battery Life.
What Matters Most
EV battery degradation is driven by the interaction between time, temperature, State of Charge, energy throughput, and battery design.
The most important distinctions are:
- Temporary range loss is not necessarily degradation
- Capacity fade and power fade are different
- Calendar and cycle ageing overlap
- High temperature is a major long-term stressor
- Cold becomes particularly relevant during charging
- Frequent high-power DC charging is associated with faster degradation, but remains a normal EV use
- Time spent at extreme SOC matters more than occasionally passing through it
- Battery ageing is rarely perfectly linear
- Degradation is not the same as component failure
- Dashboard range is not a battery-health test
Modern EV batteries are generally proving durable, but there is no single percentage that describes every vehicle. Chemistry, cooling, cell design, BMS calibration, climate, and use pattern determine how each pack ages.
For warranty thresholds and the options available after vehicle service, see EV Battery Warranty and EV Battery Lifecycle, Repair, Second Life and Recycling.