
Battery Charging and Charging Performance
Charging converts electrical energy from the grid or another source into chemical energy stored in an EV battery.
This chapter explains how energy reaches the battery, what determines charging power, and why two EVs connected to the same charger can perform differently; the underlying electrochemistry is covered in Battery Basics, while connectors, home charging, public infrastructure, bidirectional charging, and battery swapping are covered in the separate EV Charging guide.

Ion and electron movement during battery charging
AC and DC Charging
An EV battery stores direct-current electricity. The main difference between AC and DC charging is where alternating current from the grid is converted into the direct current required by the battery.
AC Charging
During AC charging, the charge point supplies alternating current to the vehicle. The vehicle’s onboard charger converts that AC electricity into DC before it reaches the high-voltage battery.
A home wallbox is commonly called a charger, but most of its role is to provide:
- A controlled electrical supply
- Communication with the vehicle
- Electrical protection
- Cable and connector monitoring
- Permission for current to flow
The power-conversion hardware is normally inside the vehicle. The US Department of Energy describes the onboard charger as the component that converts incoming AC electricity to the DC power needed by the traction battery. (Alternative Fuels Data Center)
A simplified AC charging path is:
Electrical grid
      ↓
AC charge point or wallbox
      ↓
Vehicle charge port
      ↓
Onboard charger: AC converted to DC
      ↓
High-voltage contactors
      ↓
Battery cells
Actual AC charging power is limited by the lowest applicable limit in the complete system:
- Building supply
- Number of electrical phases
- Circuit and charge-point rating
- Cable rating
- Vehicle onboard-charger rating
- Battery temperature and acceptance limit
- Charging settings selected by the driver
A vehicle with an 11 kW onboard charger cannot use 22 kW from an AC charge point, even when the infrastructure can supply it.
AC Charging Is Normally Best for Long Parking Periods
AC charging suits situations where the vehicle will remain parked for several hours:
- Home charging
- Workplace charging
- Hotel charging
- Overnight destination charging
- Long-term parking
Its lower power is usually sufficient when the vehicle has time to remain connected. It also avoids the cost and size of placing a high-power DC converter inside every car.
DC Fast Charging
During DC charging, the charging station performs the AC-to-DC conversion.
The station supplies regulated high-voltage DC through the vehicle’s charge port. The onboard AC charger is bypassed.
Electrical grid
      ↓
External DC charging station: AC converted to DC
      ↓
Vehicle charge port
      ↓
High-voltage contactors
      ↓
Battery cells
The station does not simply apply its maximum voltage and current. The vehicle and charging station communicate throughout the session. The vehicle requests suitable voltage and current based on the limits calculated by its battery and charging-control systems. The CCS charging sequence includes a requested DC voltage and current during precharge and subsequent charging communication. (CharIN)
The vehicle can reduce its request at any time because of:
- Battery temperature
- State of Charge
- Cell voltage
- Cell imbalance
- Charging-port temperature
- Battery current limit
- Cooling performance
- A detected fault
kW, kWh, and Charging Time
Charging discussions often confuse power and energy.
- Kilowatts, or kW, describe how quickly energy is being transferred.
- Kilowatt-hours, or kWh, describe how much energy is transferred or stored.
- Charging time depends on the energy added and the average charging power.
A simplified relationship is:
Charging time ≈ Energy added ÷ Average charging power
Consider a vehicle that adds 49 kWh between 10% and 80% SOC.
If the process takes 18 minutes:
18 minutes = 0.3 hours

Average charging power =
49 kWh ÷ 0.3 h
= approximately 163 kW
The vehicle may briefly peak at 250 kW, but the average over the session is approximately 163 kW.
This is why peak charging power alone does not describe charging time.
What Determines Actual DC Charging Power?
Actual charging power is the result of several limits acting at the same time.
It can be approximated as:
Actual charging power =
The lowest applicable charger, connector,
vehicle, and battery limit
Charger-Side Limits
The charging station can be limited by:
- Maximum total power
- Maximum output voltage
- Maximum output current
- Cable and connector temperature
- Power-module temperature
- Site connection capacity
- Battery storage or grid limits
- Power sharing between charge points
- Temporary thermal derating
A charger marketed as 350 kW does not necessarily deliver 350 kW at every combination of voltage and current. Charging equipment operates within a defined voltage-current envelope, not at one fixed power in every situation. CharIN’s DC power classes therefore specify both voltage and current capabilities. (CharIN)
Vehicle-Side Limits
The vehicle can be limited by:
- Battery voltage
- Maximum battery current
- Maximum charging power
- Cell temperature
- State of Charge
- Highest cell-group voltage
- Internal resistance
- Cell imbalance
- Cooling-system capacity
- Charge-port temperature
- High-voltage cable and busbar limits
- BMS charging strategy
The result shown on the charger is whichever limit is lowest at that moment.
Example
An EV may support:
- 500 kW maximum battery power
- 800 A maximum battery current
But the connected charger may provide only:
- 350 kW maximum power
- 500 A maximum current
The vehicle cannot reach its advertised maximum because the charger becomes the limiting component.
The Charging Curve
A charging curve plots charging power against battery State of Charge.
The curve is not flat because battery voltage, cell condition, temperature, and safe current limits change as charging progresses.
Communication, Precharge, and Ramp-Up
Before high current begins, the vehicle and station:
- Establish communication
- Lock the connector
- Verify electrical isolation
- Agree on voltage and current limits
- Precharge the vehicle’s high-voltage circuit
- Close the battery contactors
- Begin increasing current
The first seconds of a session are therefore not representative of the battery’s full charging capability.
Some EVs ramp rapidly to peak power. Others increase more gradually because of thermal conditions, charger behaviour, or BMS strategy.
Low-SOC Charging
At low SOC, the battery usually has considerable voltage headroom, but maximum power can still be restricted by:
- A cold battery
- Charger current limits
- Low pack voltage
- Cell-current limits
- Initial BMS ramp-up strategy
A high-voltage-class battery may not achieve high power at very low SOC if the charger reaches its current limit before reaching its advertised power rating.
High-Power Region
The strongest part of the curve may be controlled by current, power, or temperature.
Constant-Current Behaviour
If charging current remains approximately constant while battery voltage rises, charging power rises:
Power = Voltage × Current
Constant-Power Behaviour
If the system holds power approximately constant while battery voltage rises, current must gradually decrease.
Thermal Limiting
The BMS may reduce current if:
- Cell temperature rises too quickly
- The cooling system reaches its capacity
- The charge port or connector becomes hot
- A particular module or cell group is warmer than the rest
This can create visible steps or reductions in the charging curve.
High-SOC Taper
As the battery fills, the highest-voltage cell groups approach their upper limit.
The BMS must reduce current to prevent any monitored group from exceeding its permitted voltage. The reduction is known as the charging taper.
The taper can be influenced by:
- Cell chemistry
- Cell resistance
- Battery temperature
- Cell imbalance
- Upper buffer strategy
- Charging-current limits
- Cooling capability
The final percentages often take disproportionately long because charging current becomes low near the upper operating limit.
Peak Power Versus Average Power
Peak power describes the highest power observed during the session.
Average power describes how quickly energy is added across a chosen SOC window.
A car that reaches 400 kW for one minute and then rapidly falls below 150 kW may take longer from 10% to 80% than a vehicle that holds approximately 250 kW across most of the same window.
Useful comparisons include:
- Peak charging power
- Average power from 10% to 80%
- Average power from 10% to 100%
- Energy added in 10, 15, or 20 minutes
- Time from 10% to 80%
- Charging power at 50%, 70%, and 80% SOC
- Repeatability at later charging stops
Peak Power Is Not the Same as Road-Trip Performance
Charging performance should be judged together with vehicle efficiency.
A vehicle adding 60 kWh in 20 minutes but consuming 30 kWh/100 km gains approximately 200 km of energy under the assumed conditions.
A more efficient vehicle adding 50 kWh in the same time while consuming 20 kWh/100 km gains approximately 250 km.
For a long journey, useful charging performance depends on:
Energy added per minute
             ÷
Energy consumption per kilometre
This is why range added per minute can be useful when the underlying consumption assumptions are clear.
Manufacturer claims based on laboratory range should not be compared directly with real-world charging tests unless both use the same range and consumption basis.
Charging C-Rate
C-rate compares charging power with battery capacity.
An approximate charging C-rate is:
Charging C-rate =
Charging power in kW ÷ Battery capacity in kWh
Examples:
| Battery capacity | Charging power | Approximate C-rate |
|---|---|---|
| 100 kWh | 100 kW | 1C |
| 100 kWh | 250 kW | 2.5C |
| 50 kWh | 250 kW | 5C |
The same 250 kW charging power is much more demanding for the 50 kWh battery than for the 100 kWh battery.
This is a simplified comparison. Battery voltage changes through the session, and manufacturers may calculate C-rate using gross capacity, usable capacity, nominal ampere-hour capacity, or a particular operating point.
Voltage and Current
Charging power is calculated as:
Power = Voltage × Current
At an idealised 500 A:
| Battery voltage | Power at 500 A |
|---|---|
| 400 V | 200 kW |
| 800 V | 400 kW |
| 1,000 V | 500 kW |
These values are illustrative.
An “800-volt” battery does not remain at exactly 800 V. Actual pack voltage changes with:
- SOC
- Chemistry
- Number of series-connected cells
- Temperature
- Current
- Manufacturer voltage limits
A nominally 800-volt-class battery may operate substantially below 800 V through much of the charging session.
Current-Limited Charging
Current has become one of the most important limits for the latest high-power EVs.
Consider a charger limited to 500 A.
At an actual battery voltage of 700 V:
Power = 700 V × 500 A
      = 350 kW
An EV capable of more than 500 kW cannot reach that power on the charger, even if both the car and station are marketed as high-voltage systems.
Higher current requires:
- Larger conductive paths
- Lower-resistance connections
- Stronger connector cooling
- More capable liquid-cooled cables
- Better temperature monitoring
- High-current contactors and busbars
A charger’s headline power rating therefore needs to be considered together with its maximum current.
400-, 800-, and 1,000-Volt-Class Charging
The detailed vehicle-architecture differences are covered in Battery Pack & Configuration.
For charging, the main advantage of higher voltage is that the same power can be delivered at lower current.
400-Volt-Class Batteries
A well-engineered 400-volt battery can charge quickly, particularly when it has:
- High current capability
- Strong cooling
- Low cell resistance
- A broad charging plateau
- A sufficiently capable charger
Its main challenge is reaching very high power without extreme current.
800-Volt-Class Batteries
An 800-volt-class battery can reach high charging power while staying within lower current levels than an equivalent 400-volt system.
This can reduce:
- Cable losses
- Connector heating
- Busbar losses
- Cooling demand in conductors
It does not automatically improve the cell charging C-rate or guarantee a better charging curve.
1,000-Volt-Class Batteries
Newer platforms are moving beyond the established 800-volt class.
BYD’s 2025 Super e-Platform was announced as a full-domain 1,000-volt architecture with a claimed 1,000 A battery charging current, 10C charging rate, and 1 MW peak charging power. The first announced vehicles were the BYD Han L and Tang L. BYD also announced a liquid-cooled charging terminal capable of up to 1,360 kW. (BYD)
These figures require both a compatible vehicle and new charging infrastructure. A 1 MW-capable battery connected to a conventional 500 A charger will remain current-limited.
Charging an 800-Volt Battery on Lower-Voltage Hardware
An 800-volt battery cannot charge directly from a station whose maximum output voltage is below the battery voltage.
Manufacturers use several approaches.
Dedicated Voltage Booster
A DC-DC boost converter raises the station voltage to the level needed by the battery.
This provides broad compatibility but adds:
- Cost
- Weight
- Packaging
- Conversion losses
- Cooling requirements
Motor and Inverter Used for Voltage Boosting
Hyundai Motor Group’s E-GMP architecture uses the traction motor and inverter as part of the voltage-conversion system when connected to lower-voltage DC charging hardware.
Hyundai states that the system boosts a 400 V charging input to the voltage needed by the 800 V battery without requiring a separate external adapter. (Hyundai)
The result provides compatibility, but charging power on the lower-voltage station may remain below what the vehicle can achieve on suitable high-voltage infrastructure.
Bank Charging
Another strategy is to reconfigure the battery electrically into two lower-voltage sections.
The Audi Q6 e-tron and Porsche Macan Electric can divide their 800-volt-class batteries into two approximately 400-volt banks. The banks are then charged in parallel.
Audi and Porsche specify up to 135 kW when using this method on suitable 400-volt charging equipment. The Macan does this without a separate high-voltage booster. (Audi)
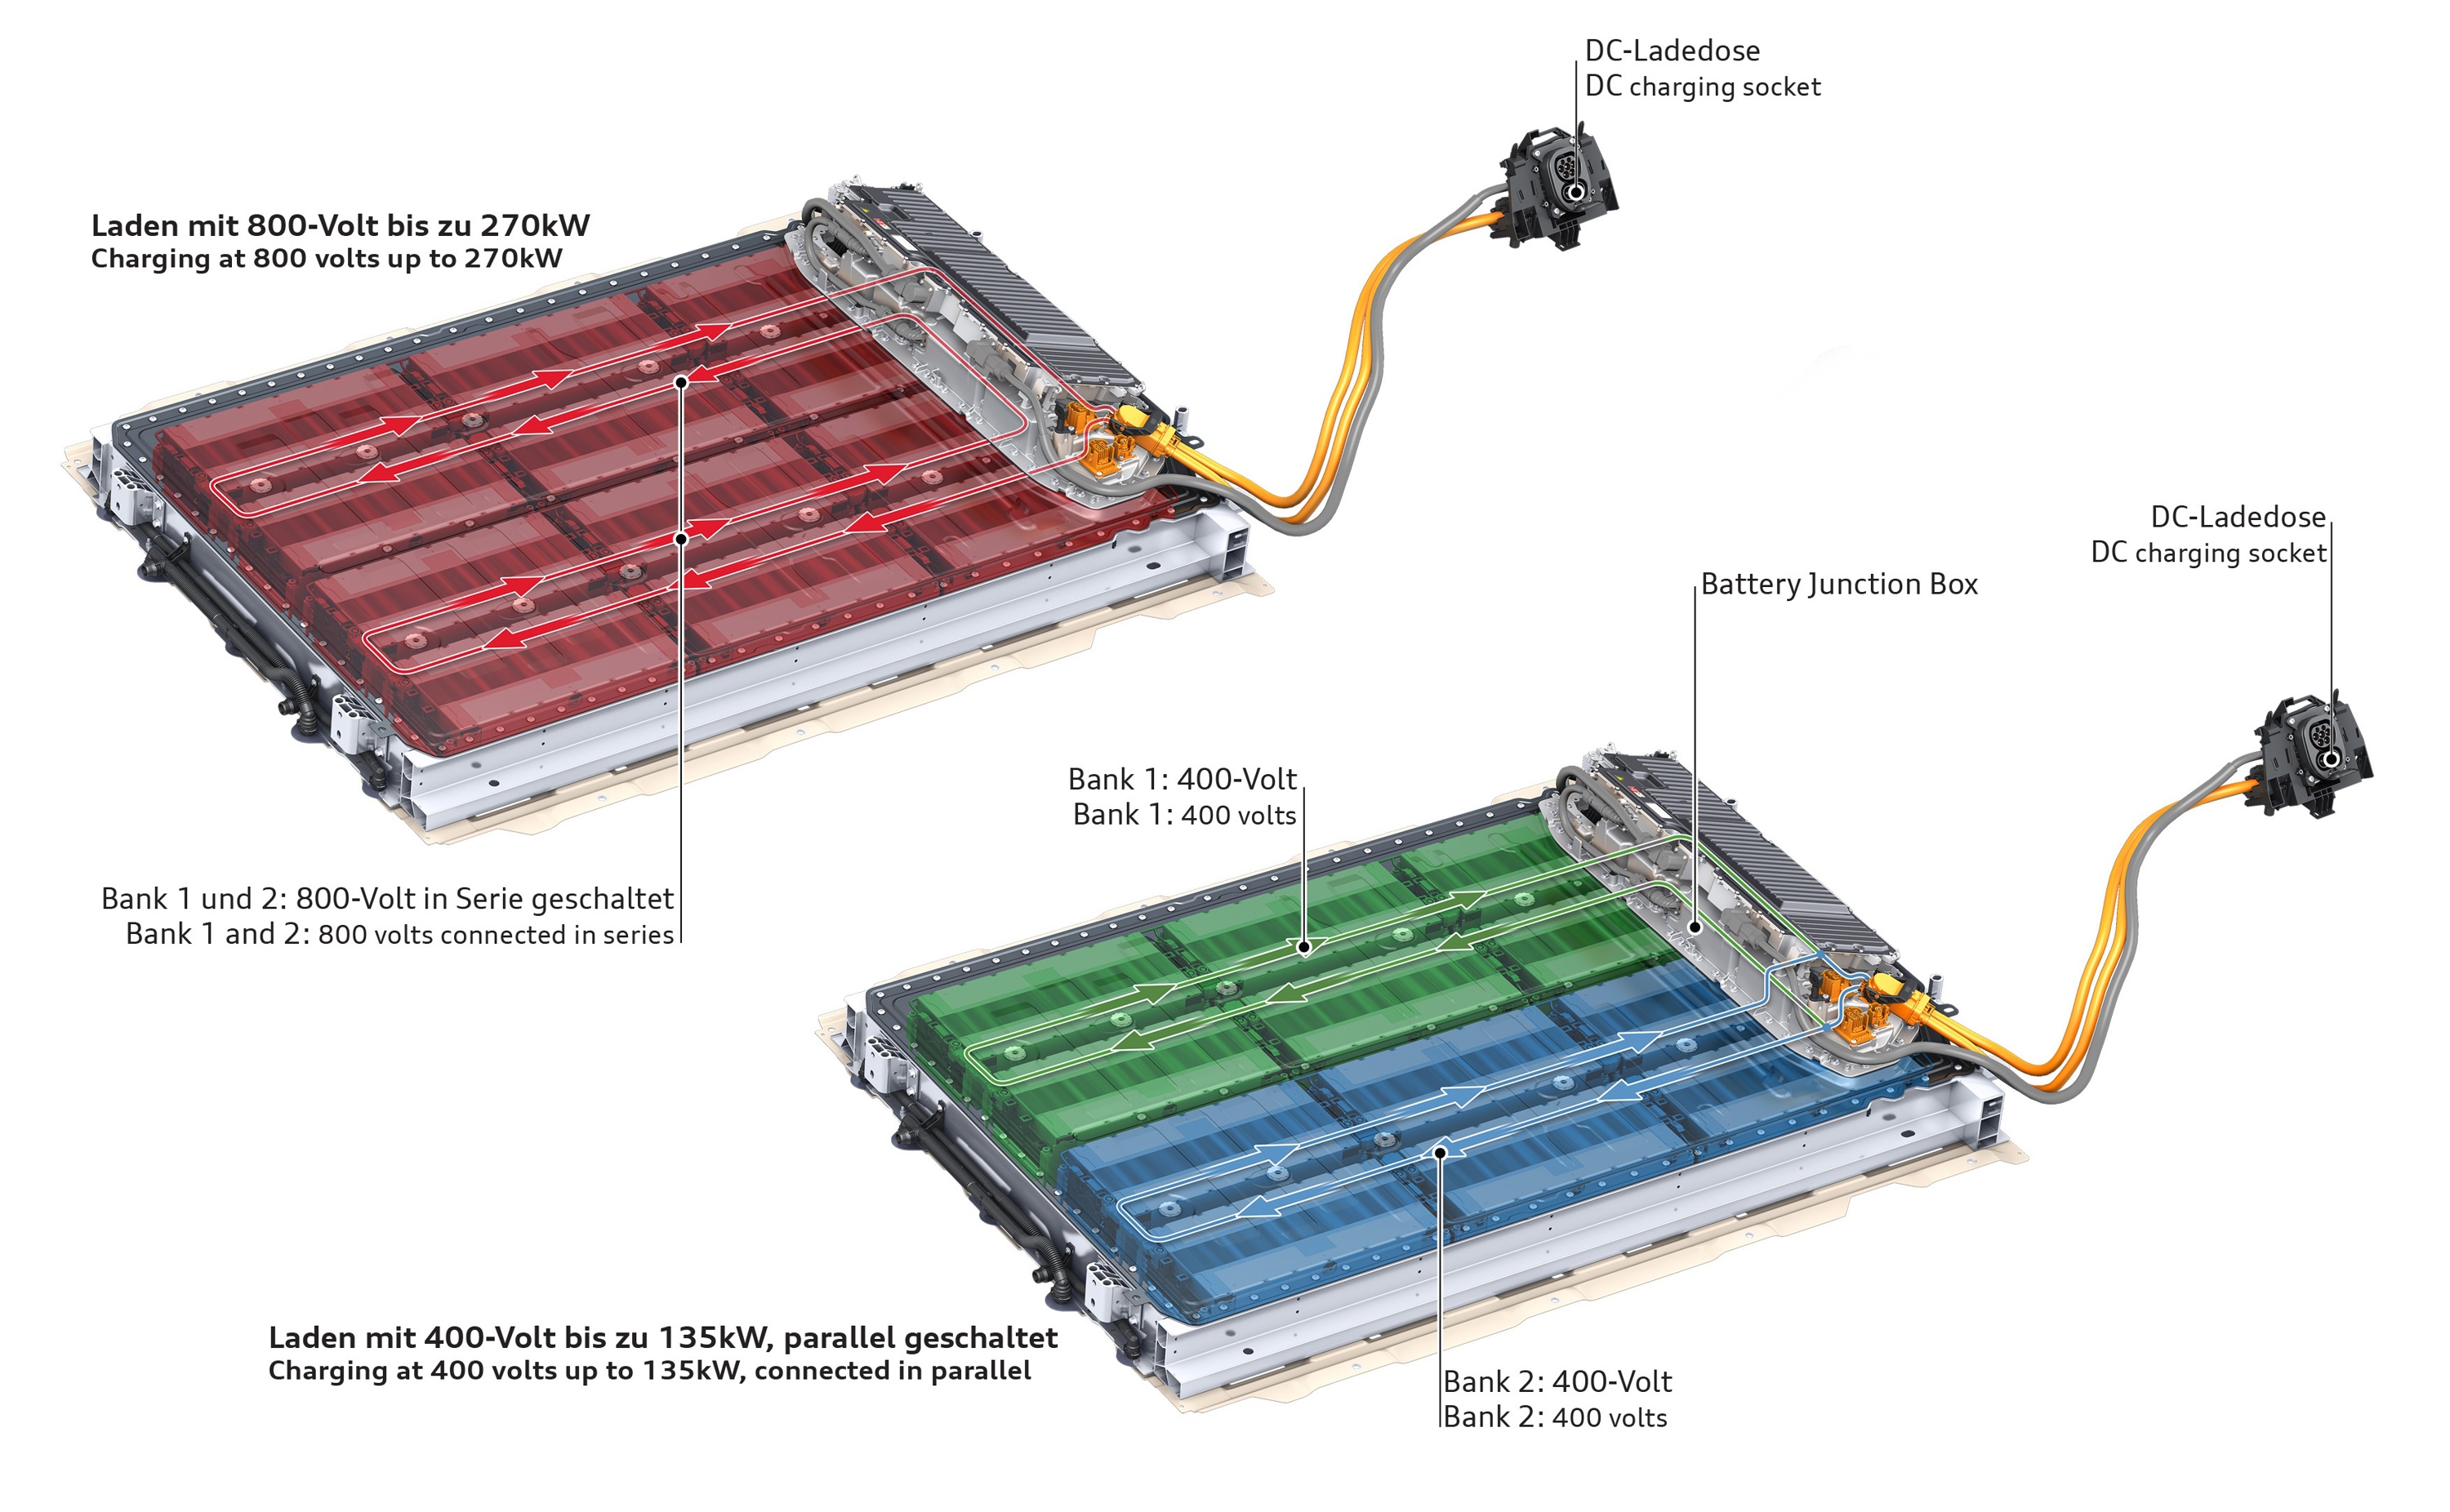
Bank charging changes the electrical connection between pack sections. It does not physically split or move the battery cells.
Battery Temperature
Battery temperature strongly affects charging performance.
A cold battery has:
- Higher resistance
- Slower ion movement
- Greater voltage rise under charging current
- Increased risk of lithium plating
- Lower permitted charging current
A battery that is too hot may also receive less power because the BMS must prevent excessive cell temperature and degradation.
The preferred charging-temperature window varies between chemistries and vehicle designs.
Battery Preconditioning
Preconditioning heats or cools the battery before arriving at a fast charger.
Activation methods can include:
- Selecting a charger in the onboard navigation system
- Automatic route planning
- Manual battery-preparation controls
- A scheduled departure
- Software prediction based on expected charging
Preconditioning does not guarantee peak power. The vehicle still needs:
- Enough preparation time
- A suitable arrival SOC
- A compatible charger
- Acceptable cell balance
- Sufficient cooling capability
The system is explained in detail in Battery Thermal Management.
BMS Charging Strategy
The Battery Management System continuously calculates the maximum voltage and current the battery can accept.
Its decision is based on values such as:
- Highest cell-group voltage
- Battery temperature
- Cell resistance
- State of Charge
- Cell imbalance
- Battery State of Health
- Cooling capability
- Fault status
The BMS communicates those limits to the vehicle’s charging controller. The vehicle then requests suitable power from the station.
This is why two vehicles with similar battery capacity and voltage can have very different charging curves.
Manufacturers can choose different priorities:
- Maximum short-term charging power
- A broad, repeatable charging plateau
- Lower battery temperature
- Conservative cell-voltage limits
- Long-term durability
- Compatibility with a wider range of chargers
A software update can change charging behaviour without changing the battery cells or charging hardware.
Charging Losses
The battery stores less energy than the charging installation draws from the grid.
Energy is lost in:
- Charging-station power electronics
- Onboard charger during AC charging
- Cables and connectors
- Vehicle conductors
- Battery resistance
- Cooling pumps and fans
- Air-conditioning compressor
- Battery heaters
- Low-voltage electronics
During AC charging, conversion losses in the onboard charger can be a significant part of the difference.
During DC charging, the station performs the main AC-to-DC conversion, but energy is still consumed by the battery and vehicle thermal systems.
The number shown by the station can represent energy delivered at the station output rather than energy finally stored chemically in the cells.
See the EVKX Charging Loss article for a detailed breakdown.
Repeated Fast Charging
One strong charging session does not guarantee the same result at the next stop.
Heat accumulates in:
- Cell interiors
- Cooling plates
- Coolant
- Busbars
- Charge-port contacts
- Battery enclosure
- Power electronics
The thermal system must:
- Remove heat during charging
- Continue cooling after departure
- Prepare the battery for the next stop
- Prevent large temperature differences across the pack
A vehicle with a lower peak but strong repeatability may complete a long trip faster than one that achieves a spectacular first session and then slows significantly.
Repeated charging performance is particularly relevant during:
- Summer motorway journeys
- Autobahn driving
- Towing
- Mountain routes
- Successive high-power stops
- High ambient temperature
How to Compare Charging Performance
A useful charging comparison should include more than one number.
Relevant Metrics
Compare:
- Peak charging power
- 10–80% time
- Energy added from 10% to 80%
- Average charging power
- Charging power at higher SOC
- Approximate peak and average C-rate
- Charger voltage and current requirements
- Cold-weather performance
- Preconditioning support
- Repeated-stop performance
- Vehicle efficiency
Use the Same SOC Window
A 10–80% claim cannot be compared directly with:
- 20–80%
- 10–70%
- 10–90%
- 30–80%
The energy transferred is different.
A five-minute 10–70% result may be outstanding, but it does not describe the time needed to reach 80%, 90%, or 100%.
Compare Energy, Not Just Percentage
Adding 60% to a 120 kWh battery represents more energy than adding 60% to a 60 kWh battery.
This is why average charging power and kilowatt-hours added provide essential context.
Check Charger Requirements
A charging curve may require:
- More than 500 A
- More than 800 V
- A proprietary charger
- A specially cooled cable
- A charger that does not share power
- Battery preconditioning
A vehicle that charges exceptionally on one charger may perform very differently on the existing public network.
Read EVKX Charging Curves Carefully
EVKX provides charging curves for individual vehicle variants.
Each curve should be read together with:
- Battery variant
- Source and test conditions
- Starting battery temperature
- Charger capability
- SOC window
- Whether power was measured or manufacturer-claimed
- Any alternate current-limited scenarios
A curve recorded under optimal conditions is not a guarantee that every charging session will reproduce it.
Current High-Power Charging Examples
The examples below show different stages of high-power charging development. Additional EVKX model curves can be added to illustrate strong 400-volt systems, established 800-volt charging, moderate but flat curves, and charger-current limitations.
XPENG X9: High-Current 800-Volt Charging
The European XPENG X9 is a useful example of how battery C-rate, pack voltage, and charger current capability now converge.
XPENG’s 2026 German specifications list:
- 800-volt architecture
- 5C charging
- Up to 537 kW for the 94.8 kWh LFP Standard Range
- Up to 542 kW for the 110 kWh NCM Long Range and Performance
- 20–80% in a claimed ten minutes
Other regional XPENG material quotes 10–80% in 12 minutes, so the exact SOC window and homologated specification should be identified for the market and vehicle variant being described. (XPENG)
At 800 V, 542 kW corresponds to approximately 678 A:
Current = 542,000 W ÷ 800 V
        = approximately 678 A
Actual battery voltage can be below 800 V, requiring even more current. A charger limited to 500 A therefore cannot reproduce the vehicle’s full charging power.
The X9 is a strong example of why the next charging bottleneck is often current capability rather than the charger’s headline power alone.
BYD Super e-Platform: 1 MW
BYD introduced the first generation of its megawatt passenger-car charging system in 2025.
The manufacturer claims:
- Full-domain 1,000-volt architecture
- 1,000 A charging current
- 10C peak charging rate
- 1,000 kW peak charging power
- 400 km of claimed range added in five minutes
- Charging hardware capable of up to 1,360 kW
The first announced vehicles were the BYD Han L and Tang L. (BYD)
These are manufacturer claims under specified conditions. They do not describe charging on ordinary public chargers.
Blade Battery 2.0 and 1.5 MW Flash Charging
In 2026, BYD announced a second generation of its Blade Battery and Flash Charging technology.
For the new Denza Z9 GT implementation, BYD claims:
- Up to 1,500 kW through one charging connector
- 10–70% in five minutes
- 10–97% in nine minutes
- 20–97% in 12 minutes at −30°C
- A battery capacity of approximately 122 kWh
BYD’s announcement connects the highest 1,500 kW figure with its latest dedicated Flash Charging station and notes a Chinese-market single-cable implementation. The European infrastructure version and independently measured charging curve remain important points to verify as the system launches. (BYD)
The 2026 Flash Charging Z9 GT should not be treated as electrically identical to earlier Z9 GT variants. The battery generation and charging system need to be identified separately when presenting EVKX charging data.
Megawatt Charging Does Not Mean Every Stop Takes Five Minutes
Megawatt charging can reduce the battery-connected portion of a stop, but the complete experience also includes:
- Entering the charging site
- Finding an available compatible charger
- Connecting the cable
- Authentication and payment
- Charging-system startup
- Reaching the desired SOC
- Disconnecting and leaving
The highest charging claims also depend on:
- A specific starting SOC
- A prepared battery
- Compatible infrastructure
- No charger derating
- No site power limitation
- Suitable battery temperature
- The vehicle following its claimed curve
These systems bring battery charging time closer to a conventional fuel stop under ideal conditions, but they do not make all charging sessions equivalent to refuelling.
What Matters on a Long Journey
The best charging vehicle is not necessarily the one with the highest number in its brochure.
The most useful system combines:
- A battery that accepts high power
- A broad charging curve
- Efficient thermal management
- Reliable preconditioning
- Compatibility with available chargers
- Strong repeatability
- Low energy consumption
- Clear route planning
Peak power helps with short low-SOC stops. Average power determines how quickly energy is added. Vehicle efficiency determines how far that energy takes the car.
Charging performance is therefore a property of the complete vehicle, battery, charger, and journey—not one isolated kilowatt figure.
Sources
- Alternative Fuels Data Center — How all-electric cars work
- CharIN — Combined Charging System design guide
- CharIN — DC CCS power classes
- BYD — Super e-Platform with megawatt charging
- Hyundai — E-GMP electric platform
- Audi — Q6 e-tron battery and charging
- XPENG — X9 configurator
- BYD — Denza Z9 GT Flash Charging