
How to Check Battery Health with a Capacity Estimate
A long drive can provide a useful estimate of the battery energy available across the dashboard's state-of-charge window. It cannot, by itself, verify the battery's complete state of health.
The short answer
This method combines distance, the trip computer's energy consumption, and the change in displayed State of Charge (SOC). The result is an estimate of the energy represented by the displayed SOC window under the conditions of that drive.
If the estimate is compared with a matching new-battery reference, it can indicate capacity retention. Capacity retention is only one part of State of Health (SoH). It is not a universal SOH value and does not directly measure internal resistance, power capability, cell-level condition, or fault status.
Use this as a repeatable owner check, not as a warranty-grade or safety assessment. Do not run the battery lower than is safe for the route, weather, and available charging.
Before you start
The estimate is most useful when all of the following are true:
- The trip computer reports consumption for the complete test drive, not only a recent rolling distance.
- You know whether the displayed consumption includes all relevant vehicle loads. The definition varies between vehicles.
- You have a new-battery reference with the same boundary as the estimate. Gross capacity, net or usable capacity, the displayed 100–0% window, and energy available below displayed 0% are not interchangeable. See Gross and Net Battery Capacity and Battery Buffer and Usable Capacity.
- The battery is near its normal operating temperature, and the vehicle has no battery or thermal-system warnings.
- The BMS has had a reasonable opportunity to calibrate SOC. Follow the manufacturer's charging guidance; some vehicles may revise the displayed SOC after charging, resting, or a deep drive.
- The vehicle does not materially change its usable buffer as it ages, or you know that the comparison accounts for that change.
A wide SOC interval reduces the effect of dashboard rounding. Aim to use at least 70–80 percentage points when practical, but stop earlier if continuing would create risk or inconvenience. A test over 10 or 20 percentage points is usually too sensitive to rounding and estimation error.
How to make the estimate
- Charge the vehicle close to 100%, then record the displayed start SOC.
- Reset a trip meter that records both distance and average energy consumption for the complete drive.
- Drive normally over a broad SOC interval. Avoid unusually high power, long periods of parked climate use, or conditions that make the test difficult to repeat.
- Record the distance, average consumption, and displayed end SOC before resetting or charging.
- Calculate the trip computer's reported energy use.
- Divide that energy by the fraction of displayed SOC used.
For a vehicle reporting kWh/100 km:
Reported trip energy (kWh) =
Distance (km) × Consumption (kWh/100 km) ÷ 100
For a vehicle reporting miles/kWh:
Reported trip energy (kWh) =
Distance (miles) ÷ Efficiency (miles/kWh)
Then calculate the displayed SOC interval and extrapolate it:
Displayed SOC used = Start SOC - End SOC

Estimated energy for the full displayed window (kWh) =
Reported trip energy ÷ (Displayed SOC used ÷ 100)
If you have a matching new-battery reference:
Capacity-retention estimate (%) =
Estimated displayed-window energy ÷ Matching new reference × 100
The calculation assumes that each displayed percentage point represents an equal share of usable energy. The BMS mapping is an estimate and may not be perfectly linear, especially near the upper and lower limits.
Worked example in kilometres
Assume a vehicle has a matching new usable-energy reference of 86.5 kWh. It travels 308 km at a displayed average of 25 kWh/100 km, starting at 100% and ending at 5%.
Reported trip energy = 308 × 25 ÷ 100
                     = 77.0 kWh

Displayed SOC used = 100% - 5%
                   = 95%

Estimated full-window energy = 77.0 ÷ 0.95
                             = 81.1 kWh

Capacity-retention estimate = 81.1 ÷ 86.5 × 100
                            = 93.7%
This drive produced an estimate about 6.3% below the chosen new-battery reference. It does not prove 6.3% permanent degradation. The difference also contains measurement uncertainty and condition-dependent effects.
Worked example in miles
Using the same 86.5 kWh reference, assume the vehicle travels 169 miles at 2.6 miles/kWh, starting at 100% and ending at 21%.
Reported trip energy = 169 ÷ 2.6
                     = 65.0 kWh

Displayed SOC used = 100% - 21%
                   = 79%

Estimated full-window energy = 65.0 ÷ 0.79
                             = 82.3 kWh

Capacity-retention estimate = 82.3 ÷ 86.5 × 100
                            = 95.1%
This drive produced an estimate about 4.9% below the reference. Results from separate drives should not be averaged blindly unless the temperature, SOC window, software, and energy accounting are reasonably comparable.
Available energy is not the same as SOH
The calculation estimates one energy quantity. Battery health is broader.
State of Health (SoH) may refer to remaining energy capacity, remaining power capability, resistance growth, or a manufacturer-specific combination. UN Global Technical Regulation No. 22 uses the narrower term State of Certified Energy (SOCE) for energy retention and distinguishes an onboard estimate from measured usable battery energy. UNECE: UN Global Technical Regulation No. 22
A battery can retain much of its usable energy while developing higher Battery Internal Resistance. That can cause more voltage sag and heat under load, earlier voltage limits, reduced acceleration or regeneration, and slower fast charging. A gentle drive-based capacity estimate does not measure those effects directly.
The calculation also does not rule out:
- A weak or imbalanced cell group
- Abnormal self-discharge
- Isolation, contactor, sensor, or cooling-system faults
- A battery that reaches voltage or temperature limits too early under high load
- A changed software buffer
- Physical damage or a repair history
Capacity fade and power fade are related but distinct parts of Battery Degradation. A complete assessment may therefore combine an energy test with diagnostics, cell-voltage comparison, resistance or pulse-power testing, fault history, and inspection.
Why the estimate varies
One result can move by several percentage points without a matching permanent change in the battery. Common causes include:
- Rounded start and end SOC values
- Rounded distance and consumption values
- Energy loads omitted from the trip computer
- Battery temperature and temperature change during the drive
- High current and resistive losses
- Wind, wet roads, elevation, tyres, and driving speed
- Cell imbalance or a BMS calibration correction
- Software changes to the usable window or consumption display
- Ending the test while the battery is still under load rather than after comparable settling conditions
High consumption does not by itself diagnose high internal resistance. The battery may simply have faced higher speed, climbing, cold weather, cabin heating, or other loads. Resistance assessment requires voltage-and-current behaviour under a defined load and temperature, not just a trip average.
For trend tracking, repeat the test over a similar SOC interval and under broadly comparable conditions. Record battery temperature when available, ambient temperature, software version, start and end SOC, distance, consumption, and the calculated estimate. Look for a sustained trend rather than treating the lowest single result as the battery's health.
The historical owner log below illustrates how repeated estimates can be plotted against total energy use and trip consumption. Its 83.6 kWh baseline is part of that log, not a universal reference for every e-tron 55 version.
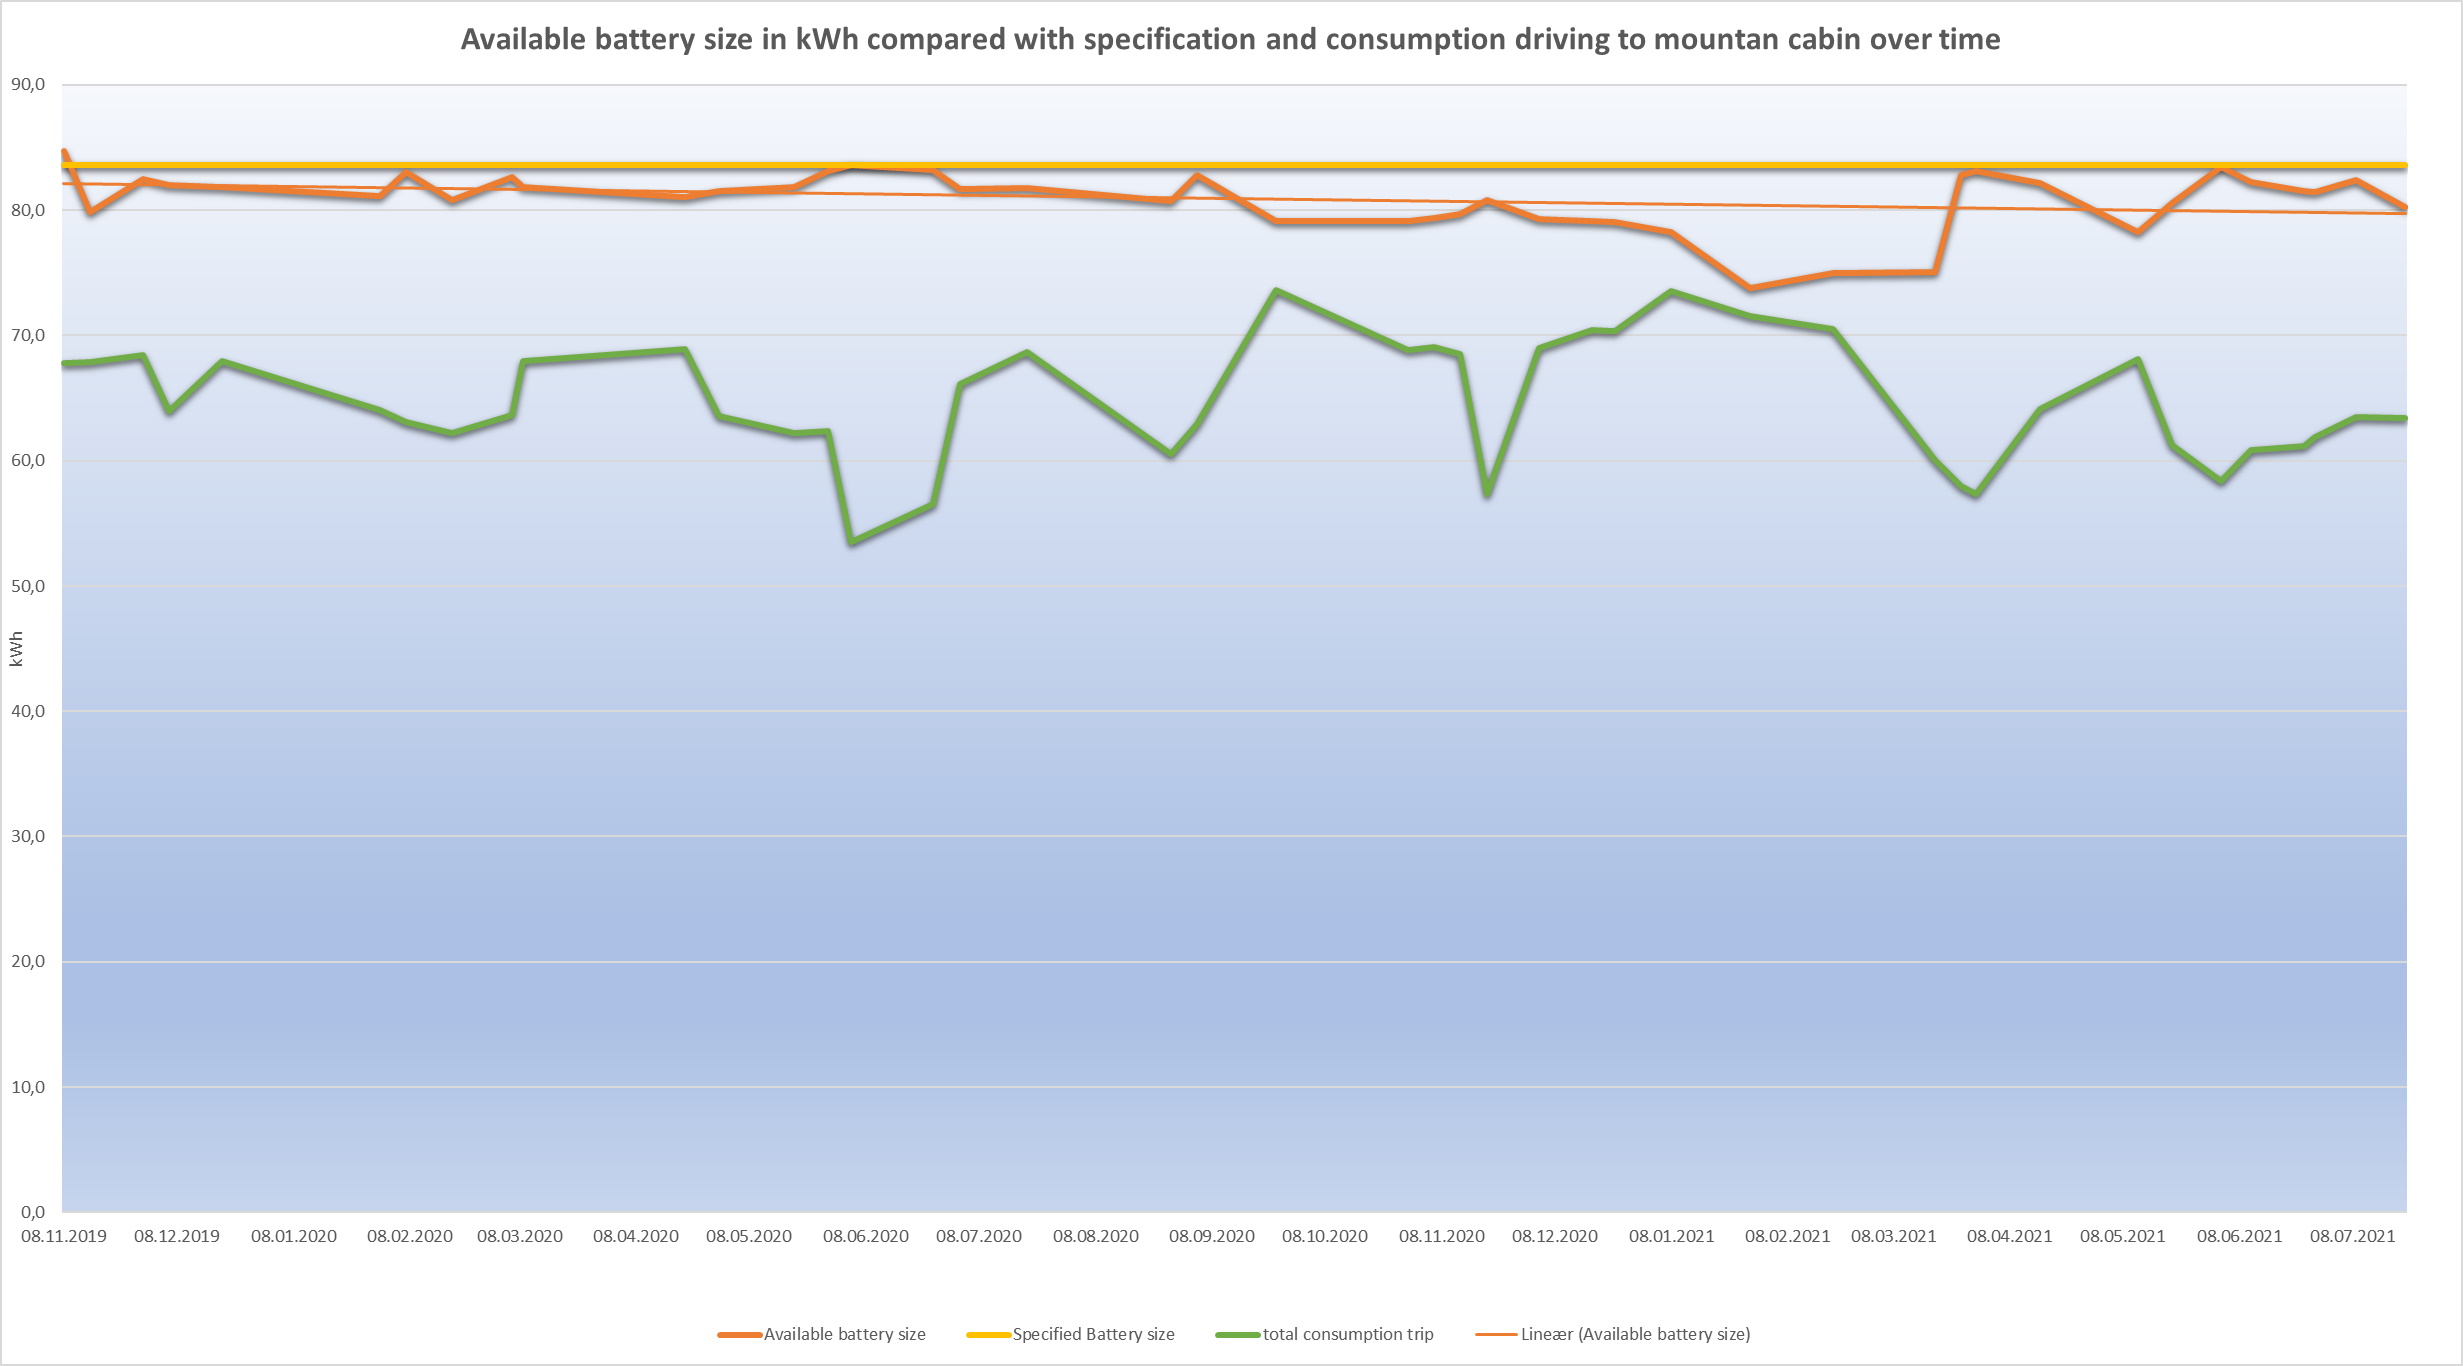
Drive-based battery-energy estimates compared with total energy consumption
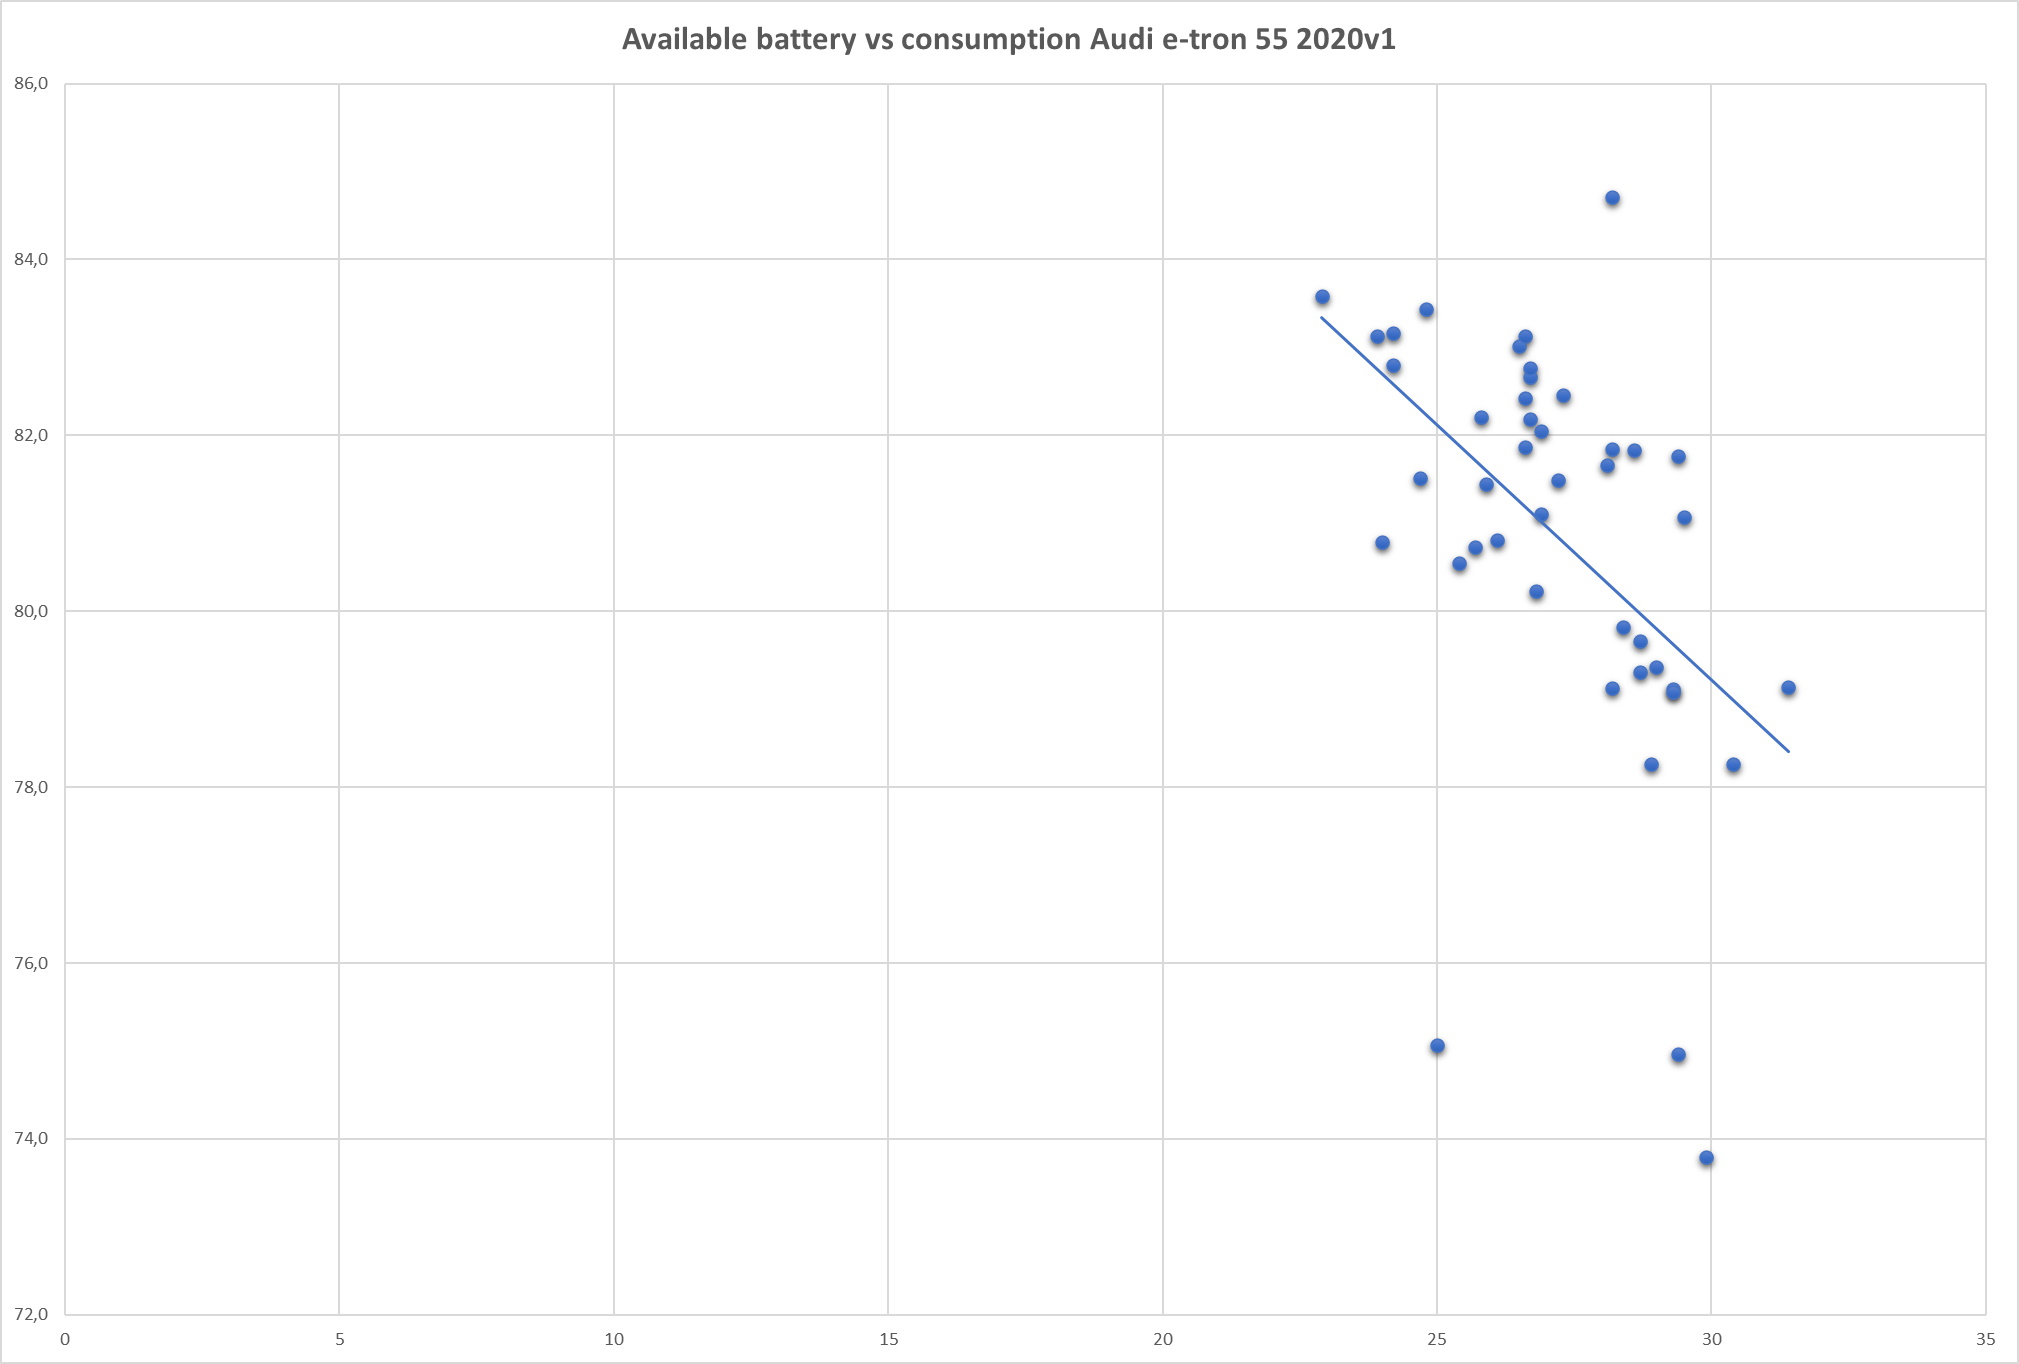
Drive-based battery-energy estimates compared with trip consumption
When to use a professional or manufacturer test
Use the vehicle manufacturer's approved procedure when the result may affect a warranty claim, purchase decision, or repair. The accepted metric may be different from this calculation.
Some vehicles offer a built-in test. Tesla, for example, describes a supported-vehicle test that can take up to 24 hours and reports energy retention compared with when the battery was new. That controlled process is different from extrapolating one trip. Tesla Model Y Owner's Manual: High Voltage Battery Health
Laboratory and workshop procedures often evaluate energy and power separately. The US Department of Energy's EV battery test manual defines capacity, available-energy, and peak-power assessments as distinct performance measures, while an NREL-supported battery assessment describes capacity and internal-resistance tests as separate health indicators. US Department of Energy: Battery Test Manual for Electric Vehicles NREL: Procedure for Assessing the Suitability of Battery Second Life Applications
For how the BMS estimates SOC, energy, power, and health, see Battery Management System.