
How EPA EV Range and Efficiency Are Calculated
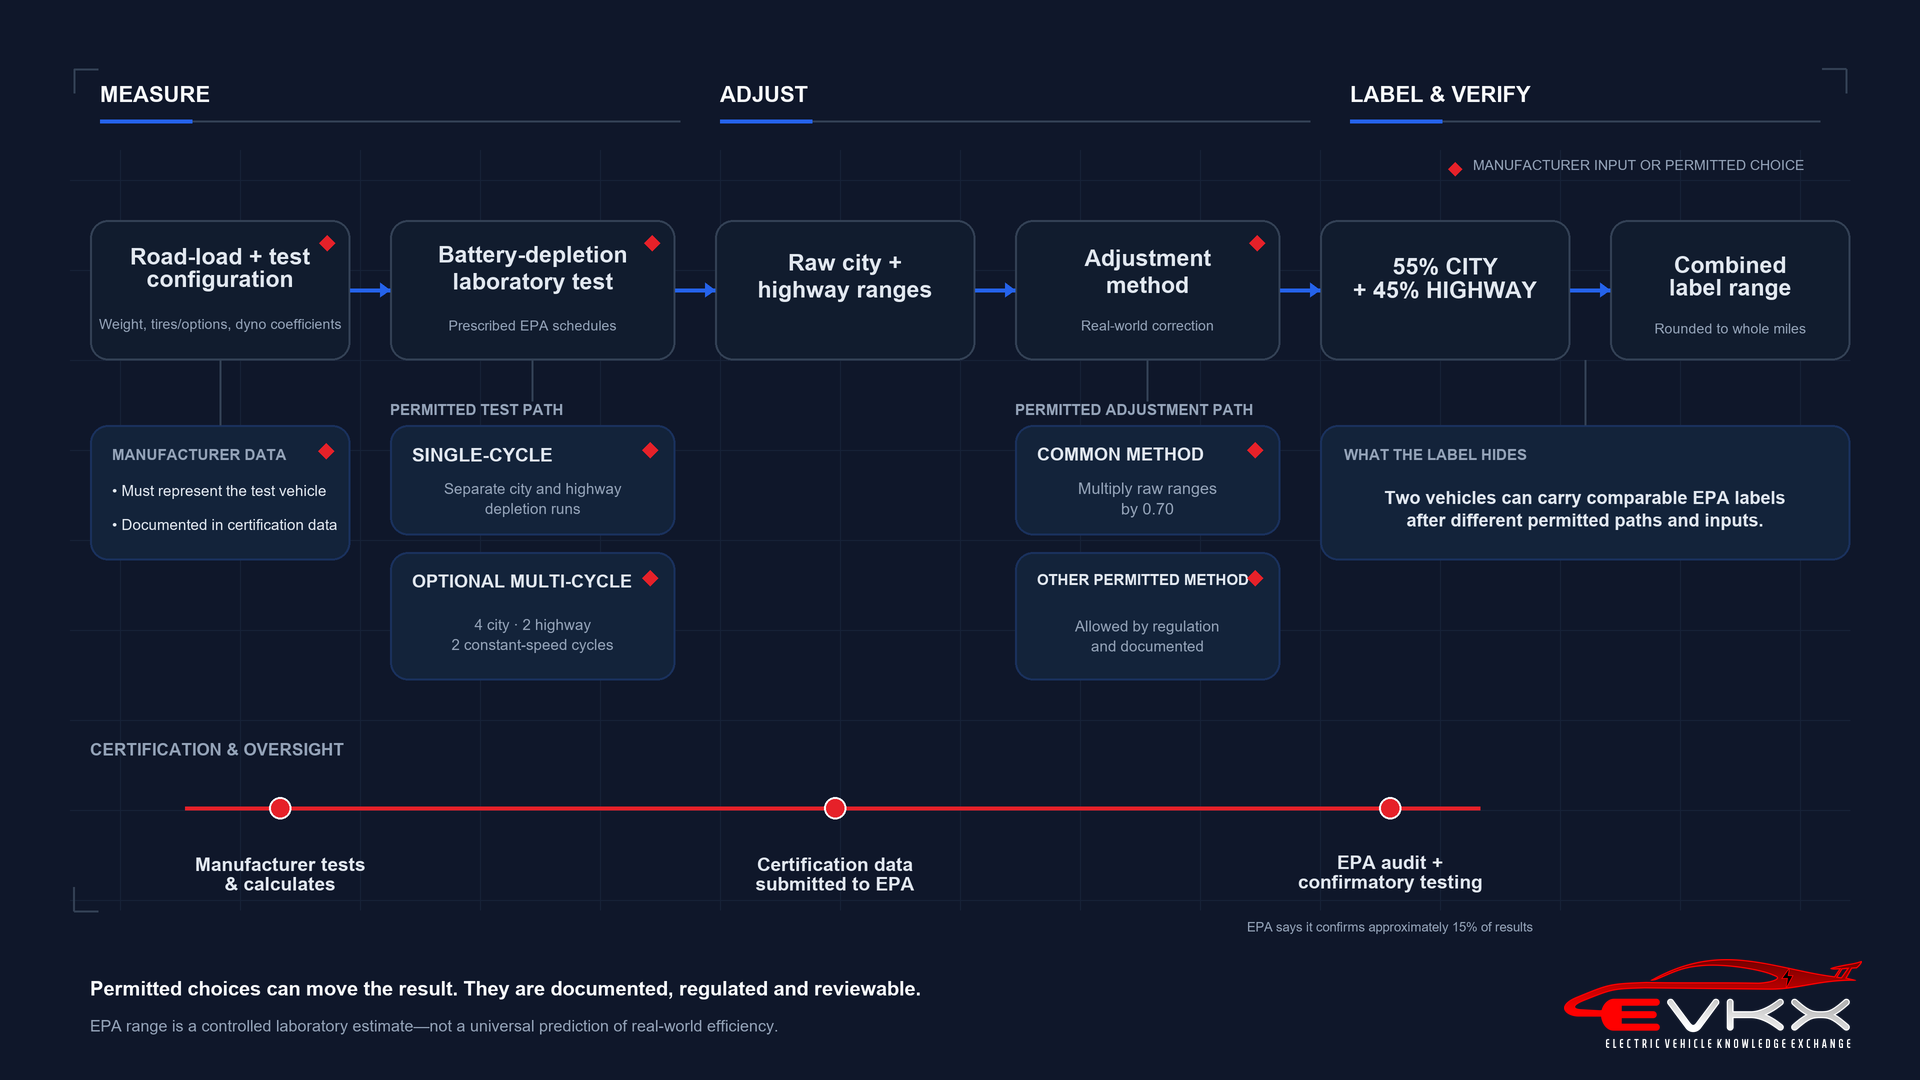
An EPA range figure starts with laboratory city and highway results, then is adjusted to account for air conditioning, cold weather and harder driving. The label's consumption figure includes electricity lost during recharging, so it cannot be compared directly with consumption measured at the battery.
What the EPA label reports
For a battery-electric vehicle, the U.S. label gives estimated range, electricity consumption in kWh/100 miles and miles per gallon equivalent, or MPGe. It also includes estimated charging time and annual energy costs.
MPGe expresses distance travelled per unit of energy. EPA uses 33.705 kWh for one U.S. gallon of gasoline equivalent:
MPGe = 33.705 kWh per gallon equivalent ÷ electricity consumption in kWh per mile
For example, 105 MPGe corresponds to approximately 32.1 kWh/100 miles. The electricity figure includes energy lost between the AC supply and the battery during recharging. This is useful for comparing purchased energy, while the car's consumption display may measure energy leaving the battery. U.S. EPA: 2020 Automotive Trends Report, Appendix E — electric-vehicle energy accounting
Multiplying EPA label range by electricity consumption does not measure usable battery capacity, because consumption includes electricity lost during recharging. Under the fixed 0.7 method, the range reduction and the corresponding increase in consumption per mile cancel in this product. Combining city and highway results, rounding and any voluntary label reductions can still affect the result. 40 CFR 600.210-12: Fuel economy label calculation procedures For the practical difference between electricity bought and energy stored, see Charging Loss.
How the laboratory represents the car and road
Manufacturers conduct most testing in their own or contracted laboratories and submit the results to EPA. EPA says it confirms approximately 15% of all test results. That percentage covers the wider vehicle testing programme; it is not an EV-specific figure. U.S. EPA: Fuel Economy and EV Range Testing
The test vehicle and laboratory settings must represent the relevant configuration. Wheels, tyres and test weight matter because the dynamometer must reproduce the resistance the car would encounter on the road.
Road load on a dynamometer
A common starting point is a coastdown test. The car decelerates while its speed is recorded, allowing engineers to determine the force resisting its motion. Corrections account for the test conditions. The resulting road-load curve is commonly expressed as:
F(v) = A + B × v + C × v²
Here, F is resisting force, v is speed and A, B and C are fitted coefficients. Their units must match the chosen force and speed units. The curve includes rolling and mechanical resistance as well as aerodynamic drag; the coefficients are fitted terms rather than exact measurements of each separate source of resistance.
The laboratory then sets the dynamometer to reproduce that road load, allowing for resistance already present in the tyres and rollers. Its settings are checked by a dynamometer coastdown. A cooling fan supplies airflow, while the dynamometer applies the simulated resistance.
EPA also permits supported analytical methods. Manufacturers remain responsible for representative road-load data, and EPA can perform confirmatory coastdowns. U.S. EPA: Determination and Use of Vehicle Road-Load Force and Dynamometer Settings
Measuring depletion and recharge energy
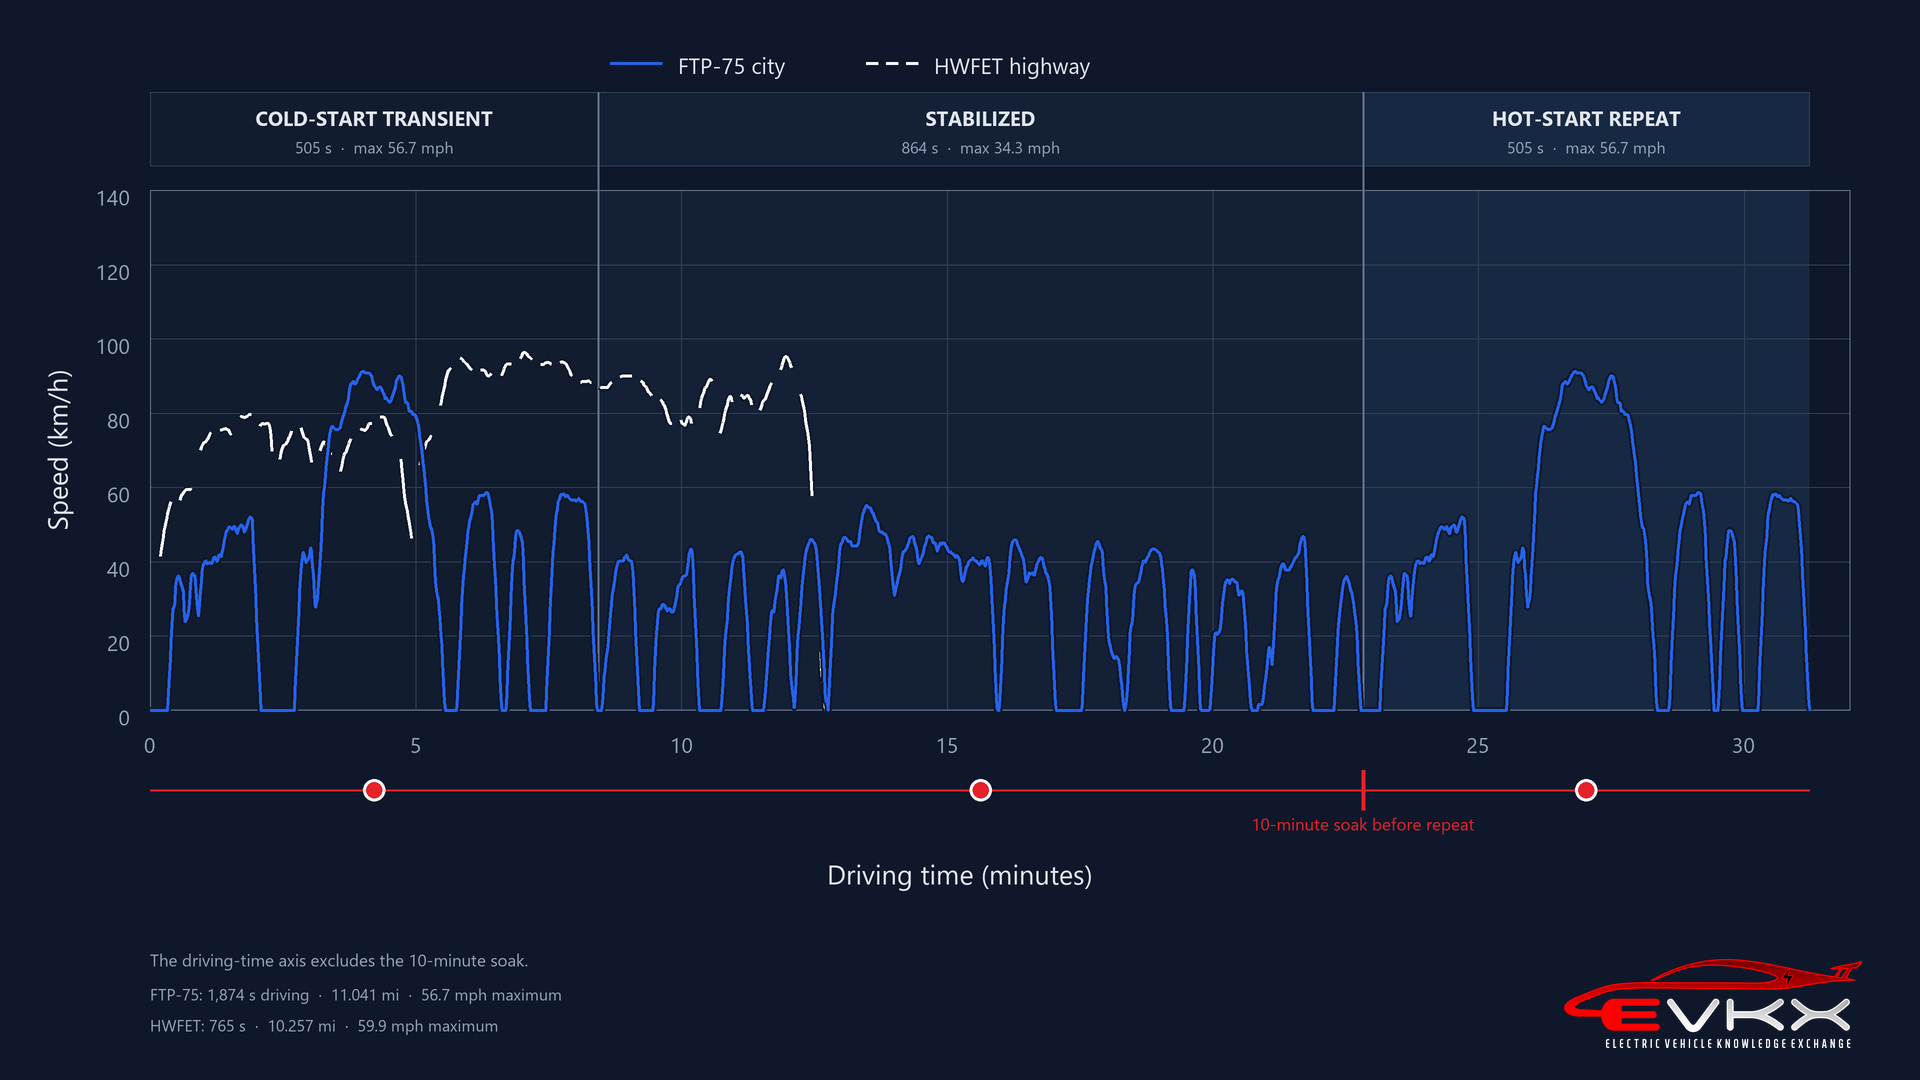
The fully charged and conditioned vehicle follows prescribed speed schedules on the dynamometer. Two basic schedules provide city and highway measurements:
- UDDS, the urban dynamometer driving schedule, includes stops and changing speeds.
- HWFET, the highway fuel-economy test, uses smoother driving at speeds below 60 mph. U.S. EPA: Dynamometer drive schedules
A highway label result therefore represents a different speed pattern from continuous driving at 70 or 80 mph.
Current federal rules incorporate the July 2017 edition of SAE J1634 and specify its Section 8 multi-cycle test, with regulatory modifications. 40 CFR 600.011: Incorporated standards, including SAE J1634 JUL2017 It combines city, highway and constant-speed segments. Manufacturers of vehicles unable to complete the required multi-cycle distance or reach the maximum city or highway cycle speeds should seek EPA approval to use the Section 7 single-cycle test. At a manufacturer's request, EPA can approve an earlier J1634 edition for data carried over from vehicles tested under it. 40 CFR 600.116-12: Special procedures related to electric vehicle driving range
The multi-cycle method measures battery energy across the full depletion test and uses the city and highway segments to determine their respective consumption and range. EPA's reporting guidance requires phase-level DC energy data, total usable battery energy and AC recharge energy. U.S. EPA guidance CD-2022-15: Electric vehicle test data reporting
What “depleted” means
Battery voltage and current are recorded throughout the driving phases:
Net DC energy = integral of battery voltage × battery current over time
With discharge current taken as positive, regenerative charging contributes negative energy. Federal rules sum the measured DC energy across the test phases to determine usable battery energy, excluding energy discharged during key-off soak periods. 40 CFR 600.116-12: Special procedures related to electric vehicle driving range
GM's application for the 2023 LYRIQ, which cites the 2012 edition of SAE J1634, specifies a depletion-test endpoint when the vehicle can no longer keep up with the required speed trace. GM: 2023 Cadillac LYRIQ certification application, test end criteria A car may still move under a gentler load after failing a criterion like this.
Displayed 0% and propulsion cutoff are separate boundaries. EVKX uses net capacity for all driver-accessible energy from displayed 100% until propulsion stops, including any accessible reserve below displayed 0%. EPA test energy can therefore differ from both a dashboard 100–0% measurement and EVKX's net-capacity definition. Battery buffer and usable capacity
After depletion, the car is recharged using AC Level 2 charging, with energy measured at the supply. This includes charging losses, so the recharge measurement and the DC energy discharged by the battery describe different quantities. U.S. EPA: Fuel Economy and EV Range Testing U.S. EPA: 2020 Automotive Trends Report, Appendix E — electric-vehicle energy accounting
BMW iX3: three capacity figures, different labels
BMW's September 2025 U.S. specifications for the iX3 50 xDrive listed 112.2 kWh as “net usable energy content”, in a table explicitly marked preliminary. BMW USA: Preliminary BMW iX3 50 xDrive specifications Its 1 April 2026 global release gives 108.7 kWh usable for the German-market vehicle, while its U.S. consumer page, checked in November 2026, describes 112.3 kWh as total capacity. BMW Group: BMW iX3 50 xDrive usable battery energy BMW USA: BMW iX3 model overview and battery specification
These differently defined manufacturer figures do not establish that the U.S. car has extra energy available below displayed 0%. Establishing a below-zero reserve would require evidence that connects displayed state of charge to discharged energy, or an explicit manufacturer definition.
EPA's record for the 2027 iX3 50 xDrive with 20-inch all-season tyres lists 383 miles of range and approximately 33.1 kWh/100 miles. Multiplying those gives about 126.8 kWh, above all three manufacturer capacity figures. This calculation uses consumption that includes charging losses; it is neither a battery-capacity measurement nor a direct measurement of recharge energy. U.S. EPA and DOE: 2027 BMW iX3 50 xDrive, 20-inch all-season tyres
Turning laboratory results into label values
The basic city and highway tests leave out conditions such as aggressive acceleration, air-conditioning use and cold weather. The five-cycle framework adds US06 for aggressive driving and higher speeds, SC03 for air-conditioning operation and a cold urban test. U.S. EPA: Dynamometer drive schedules U.S. EPA: Fuel Economy and EV Range Testing
Federal rules allow actual five-cycle results, a fixed 0.7 adjustment to two-cycle range and fuel-economy results, or an EPA-approved factor based on operating data from the manufacturer's in-use vehicles. 40 CFR 600.210-12: Fuel economy label calculation procedures
Cold testing from model year 2025
For model year 2025 onward, the vehicle-specific five-cycle adjustment calculation uses two UDDS cycles at 20°F, approximately −7°C, separated by a ten-minute key-off soak. These replace a full cold depletion test for this purpose.
Beforehand, the vehicle undergoes a 12–36-hour cold soak at 20°F without charging or preconditioning. To generate this five-cycle adjustment factor, the manufacturer must request EPA approval before testing. It may choose the starting state of charge, must report that level and the required results and calculations in a written attestation, and needs EPA's written concurrence with the proposed factor and the vehicle configurations it covers. These cold-test results contribute to the label adjustment; they do not provide a separate winter-range rating. 40 CFR 600.116-12: Special procedures related to electric vehicle driving range
A worked range example
Consider an illustrative raw city range of 400 miles and raw highway range of 350 miles. Under the 0.7 route:
Adjusted city range = 400 × 0.7 = 280 miles
Adjusted highway range = 350 × 0.7 = 245 miles
EPA combines adjusted city and highway range with 55% city and 45% highway weighting:
Combined range = 0.55 × 280 + 0.45 × 245 = 264.25 miles
Rounded to a whole mile, that gives a 264-mile label range. U.S. EPA: Fuel Economy and EV Range Testing
MPGe uses a different calculation
Combined MPGe uses the same city/highway weights, but as a weighted harmonic mean of the unrounded values:
Combined MPGe = 1 ÷ (0.55 ÷ city MPGe + 0.45 ÷ highway MPGe)
This combines energy used per mile before expressing the result as miles per gallon equivalent. Using the arithmetic range formula for MPGe would give the wrong result. Calculating from rounded city and highway figures can also differ from the published combined value. 40 CFR 600.210-12: Fuel economy label calculation procedures
Manufacturers may voluntarily lower label range or MPGe if they judge the values unrepresentative of in-use results. Lowering MPGe requires a corresponding increase in reported consumption and changes to other affected label values. The rule provides no equivalent option to raise range or MPGe. 40 CFR 600.210-12: Fuel economy label calculation procedures EPA publishes certification and test records, although reconstructing a particular label can require matching several records to the exact configuration. U.S. EPA: Data on Cars Used for Testing Fuel Economy
Rivian R2 and Tesla Model Y: the same combined MPGe
California's official DriveClean listings give the 2027 Rivian R2 Performance AWD on 21-inch wheels a 330-mile EPA range and 114 city, 96 highway and 105 combined MPGe. The 2026 Tesla Model Y Performance AWD is listed at 306 miles and 111 city, 100 highway and 105 combined MPGe. California Air Resources Board: 2027 Rivian R2 ratings by configuration California Air Resources Board: 2026 Tesla Model Y ratings by configuration
The shared combined figure hides a useful difference: the R2 has the higher city rating, while the Model Y has the higher highway rating. Their different ranges also show why efficiency alone cannot tell you how far a car will travel; available battery energy matters too.
These are weighted, rounded ratings across prescribed speed schedules. Neither combined MPGe nor the highway value tells you the cars' relative consumption at a steady 75 mph. That comparison requires measurements at the intended speed, under comparable conditions and using the same energy measurement boundary.
Using EPA figures alongside other range information
Compare the exact model year, drivetrain and wheel configuration, then look at city and highway efficiency as well as the combined figure.
When comparing a U.S. specification with a European one, use How WLTP range and consumption are measured to check how that procedure measures range and consumption. There is no fixed conversion factor between EPA and WLTP results.
For a trip estimate, Understanding EV Range connects available battery energy with consumption, weather and driving speed, including the difference between rated range and the distance available within a chosen charging window.
Sources
16
- U.S. EPA: Fuel Economy and EV Range Testing
- U.S. EPA: 2020 Automotive Trends Report, Appendix E — electric-vehicle energy accounting
- U.S. EPA: Dynamometer drive schedules
- U.S. EPA: Determination and Use of Vehicle Road-Load Force and Dynamometer Settings
- U.S. EPA guidance CD-2022-15: Electric vehicle test data reporting
- 40 CFR 600.116-12: Special procedures related to electric vehicle driving range
- 40 CFR 600.011: Incorporated standards, including SAE J1634 JUL2017
- 40 CFR 600.210-12: Fuel economy label calculation procedures
- GM: 2023 Cadillac LYRIQ certification application, test end criteria
- U.S. EPA: Data on Cars Used for Testing Fuel Economy
- BMW USA: Preliminary BMW iX3 50 xDrive specifications
- BMW Group: BMW iX3 50 xDrive usable battery energy
- BMW USA: BMW iX3 model overview and battery specification
- U.S. EPA and DOE: 2027 BMW iX3 50 xDrive, 20-inch all-season tyres
- California Air Resources Board: 2027 Rivian R2 ratings by configuration
- California Air Resources Board: 2026 Tesla Model Y ratings by configuration