Understanding Range
For many, the range is the most critical aspect of an EV. In this guide, we explain what factors affect the driving range of EVs and why new EV owners often experience a lower range than expected.
Last modified: Dec 28, 2024The range of electric cars is typically given as a WLTP range (Worldwide Harmonised Light Vehicles Test Procedure) in Europe, EPA in the US, and CLTC in China.
As of summer 2023, available models have a rated range between approximately 200 km and 900 km.
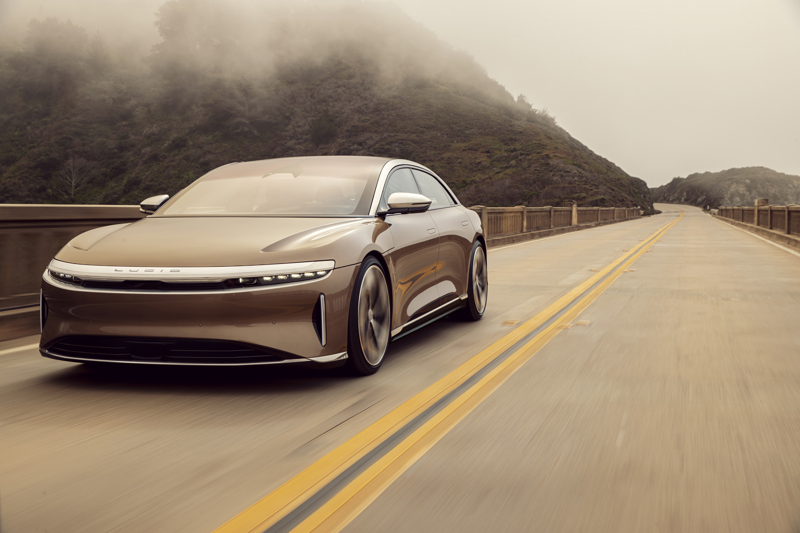
Lucid Air Dream Edition Range with 883 km WLTP range
The most critical aspect of range is the battery size. A larger battery means more energy to use.
Today's models have battery sizes ranging from approximately 40 kWh to 230 kWh, with the majority being 60-100 kWh. The table below shows the usable battery size of some of the most popular models.
| Model | Usable Battery Size (Net Size) |
|---|---|
| Volvo EX30 | 49 kWh |
| Tesla Model Y Standard Range | 57.5 kWh |
| Ford Mustang Mach E Standard Range | 70 kWh |
| Hyundai Ioniq 5 Long Range AWD | 74 kWh |
| Volkswagen ID4 Pro | 77 kWh |
| Mercedes EQE 350 4matic SUV | 90.6 kWh |
| Tesla Model S Plaid | 96 kWh |
| BMW iX 50 | 105.2 kWh |
| Audi Q8 55 e-tron | 106 kWh |
| Lucid Air Dream Edition | 117 kWh |
| Ford F150 Lightning Extended Range | 131 kWh |
You can see all models sorted by net battery size in our EV database.
However, the battery is not the only factor in the stated range. Another critical factor is how efficient the car is. Efficiency refers to how much energy the EV uses from the battery for a given distance. It is typically stated in Europe as kWh/100 km, indicating how many kWh are needed to drive 100 km. In the US and the UK, it is rated as miles per kWh, indicating how far you can go with 1 kWh.
The table below shows the calculated kWh/100 km consumption and miles/kWh for different EVs according to the WLTP combined rating.
| Model | WLTP Consumption |
|---|---|
| Volvo EX30 | 14.24 kWh/100 km / 4.4 mi/kWh |
| Tesla Model Y Standard Range | 13.37 kWh/100 km / 4.6 mi/kWh |
| Ford Mustang Mach E Standard Range | 15.91 kWh/100 km / 3.9 mi/kWh |
| Hyundai Ioniq 5 Long Range AWD | 15.38 kWh/100 km / 4.0 mi/kWh |
| Volkswagen ID4 Pro | 14.56 kWh/100 km / 4.3 mi/kWh |
| Mercedes EQE 350 4matic SUV | 16.56 kWh/100 km / 3.8 mi/kWh |
| Tesla Model S Plaid | 17.68 kWh/100 km / 3.5 mi/kWh |
| BMW iX 50 | 16.67 kWh/100 km / 3.7 mi/kWh |
| Audi Q8 55 e-tron | 18.21 kWh/100 km / 3.4 mi/kWh |
| Lucid Air Dream Edition | 13.59 kWh/100 km / 4.6 mi/kWh |
| Ford F150 Lightning Extended Range | 25.4 kWh/100 km / 2.4 mi/kWh (EPA) |
What affects the rated consumption?
The efficiency or consumption of an EV is influenced by several factors.
Aerodynamic Drag
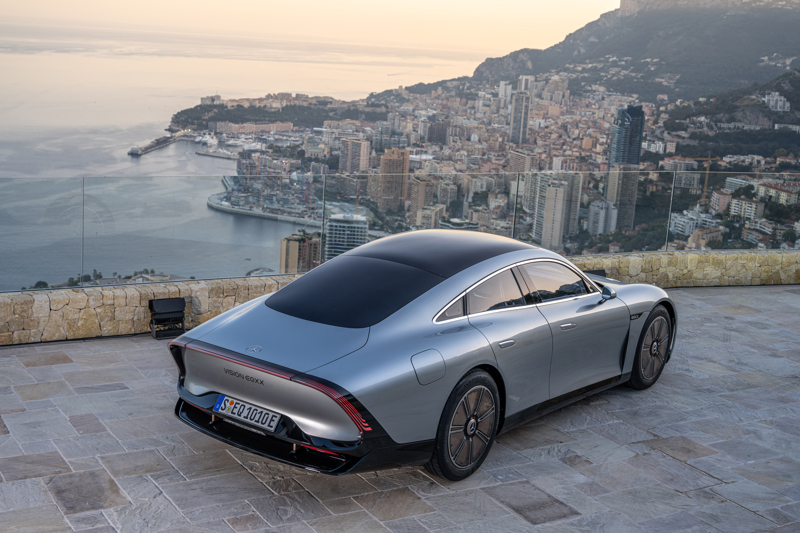
Aerodynamic drag impacts the energy required to move the vehicle. The body shape and wheel design play significant roles. The Mercedes Vision EQXX currently holds the record for the lowest drag coefficient with a Cw value of just 0.17.
Mercedes Vision EQXX with a record low drag coefficient of 0.17
You can calculate the energy needed to overcome aerodynamic drag if you know a model's drag coefficient and frontal area size. Below are examples from various models.
| Model | Drag Coefficient (cd) | Frontal Area |
|---|---|---|
| Audi e-tron SUV | 0.28 | 2.65m² |
| Audi e-tron Sportback | 0.26 | 2.65m² |
| Audi Q4 e-tron SUV | 0.28 | 2.56m² |
| Audi Q4 e-tron Sportback | 0.28 | 2.56m² |
| Audi e-tron GT | 0.24 | 2.35m² |
| Mercedes EQS | 0.20 | 2.5m² |
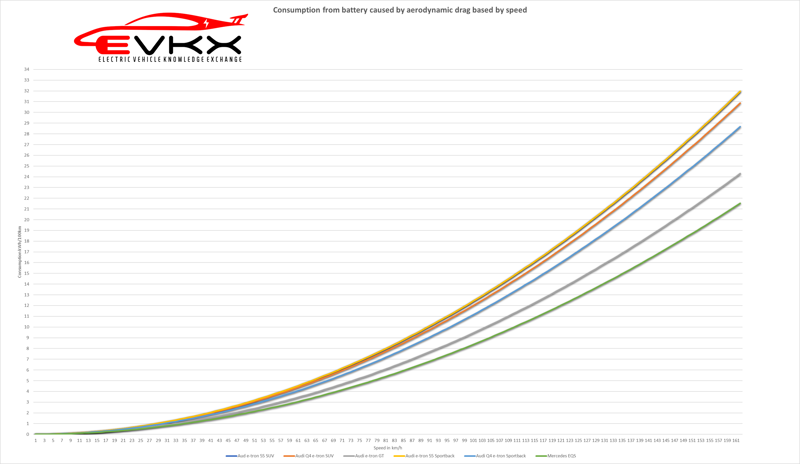
The graph below shows the aerodynamic drag consumption for different models.
Consumption from aerodynamic drag
The table below illustrates aerodynamic drag consumption at different speeds for three Audi models and the Mercedes EQS.
| Model | 50 km/h (31 mph) | 80 km/h (50 mph) | 120 km/h (75 mph) |
|---|---|---|---|
| Audi e-tron SUV | 3.04 kWh/100 km | 7.79 kWh/100 km | 17.53 kWh/100 km |
| Audi Q4 e-tron SUV | 2.94 kWh/100 km | 7.52 kWh/100 km | 16.94 kWh/100 km |
| Audi e-tron GT | 2.31 kWh/100 km | 5.92 kWh/100 km | 13.33 kWh/100 km |
| Mercedes EQS | 2.05 kWh/100 km | 5.21 kWh/100 km | 11.81 kWh/100 km |
The Mercedes EQS saves significant energy at high speeds compared to SUVs due to lower aerodynamic drag. However, this focus on aerodynamics has led to some complaints about the EQS design.
Mercedes-EQ EQS 450+
Rolling Resistance
Rolling resistance is the force resisting the motion when a tire rolls on a surface. It is influenced by tire width, car weight, tire compound, and tire pressure.
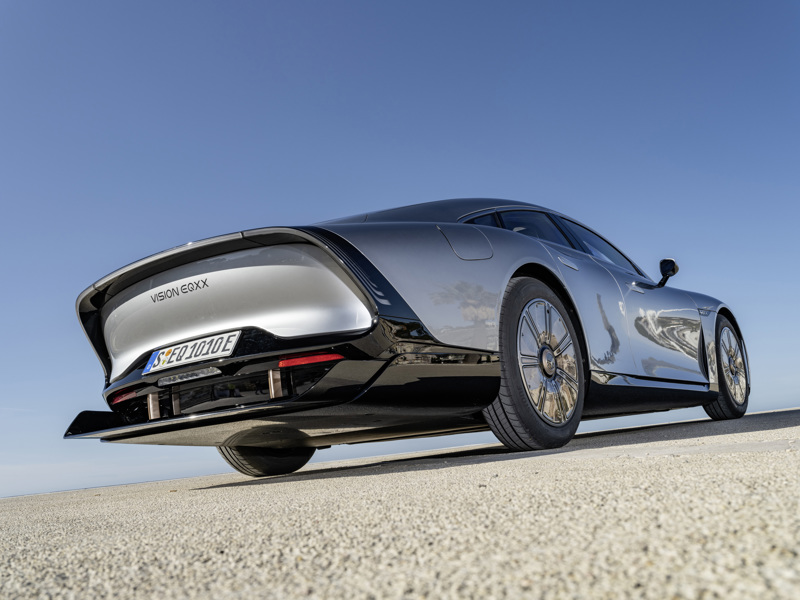
Manufacturers often offer narrow tires to advertise the best possible range, but this can reduce grip. Some manufacturers use staggered setups with narrower front tires to improve range.
Mercedes Vision EQXX has narrow tires
Some tire producers now offer specific tires for EVs with low rolling resistance to enhance range. Below is a detailed test comparing EV-optimized and regular tires.
Weight
Heavier cars require more energy to move.
Efficiency of the Drivetrain/Motors
Electric motors are generally efficient, but different motor technologies vary in consumption. Permanently excited synchronous motors use less energy but have higher coasting resistance. Induction motors use more energy but have almost zero coasting resistance. Newer cars often combine these technologies.
Internal Resistance of the Battery
Internal resistance in the battery causes heat loss.
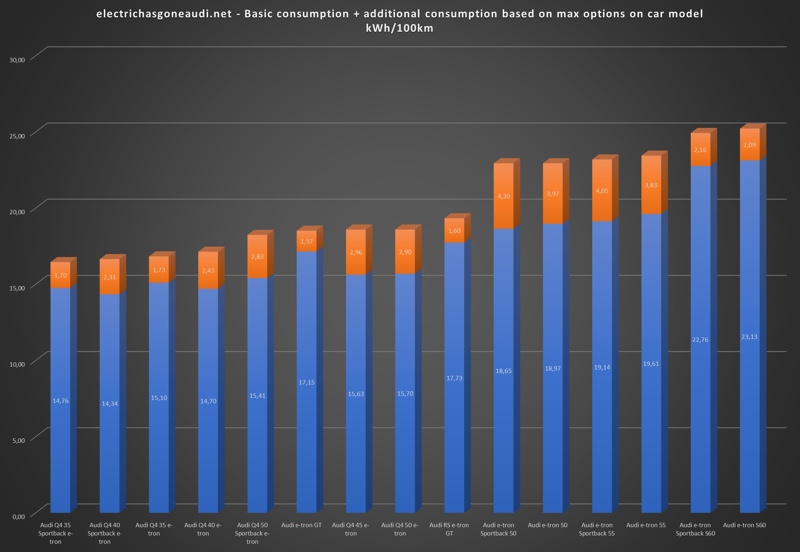
Factors Vary Based on Selected Options
The design of the EV affects many factors, but options selected by the buyer can also impact range. For example, wider tires increase consumption, and a panoramic roof can reduce range.
The diagram below shows how adding options increases WLTP consumption and reduces range for some Audi models.
WLTP Consumption added with options
For instance, an Audi e-tron 55 consumes 19.61 kWh/100 km in the basic trim but 23.44 kWh/100 km in the top trim, reducing the range from 441 km (274 miles) to 369 km (229 miles).
What affects the real-world consumption
Achieving the same range as given by WLTP or EPA in real-world conditions is almost impossible due to various factors.
Road Condition
Road conditions significantly affect consumption. Dry tarmac has lower rolling resistance compared to wet or snowy roads.
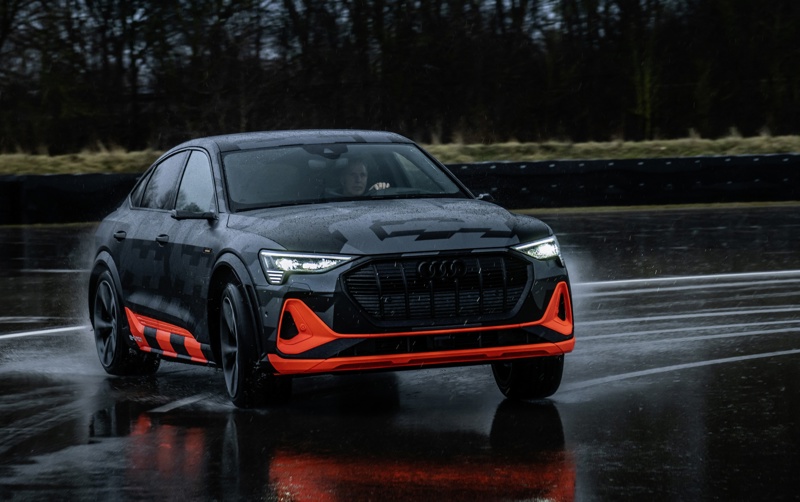
Audi e-tron S in the wet
Speed
Higher speeds increase consumption due to higher aerodynamic drag.
Temperature
Temperature changes also affect range due to various factors.
AC Consumption
Both warm and cold weather can increase the car's consumption of air conditioning systems. On a freezing day, a significant amount of battery power may be used to heat the cabin. Similarly, on hot days, the AC works hard to cool down the cabin.
Depending on the model, the maximum power that the AC can draw from the battery typically ranges from 5-10 kW.
The table below shows how different average AC consumption levels for heating/cooling affect driving consumption. Driving slowly with the heater on full blast will impact the range the most.
| Average Speed | Consumption 1kW | Consumption 2kW | Consumption 5kW |
|---|---|---|---|
| 46.5 kph / 28.9 mph (WLTP avg) | 2.15 kWh/100 km | 4.3 kWh/100 km | 10.75 kWh/100 km |
| 80 kph / 49.7 mph | 1.25 kWh/100 km | 2.5 kWh/100 km | 6.25 kWh/100 km |
| 120 kph / 75 mph | 0.8 kWh/100 km | 1.7 kWh/100 km | 4.2 kWh/100 km |
The table below shows how different models are affected by 2 kW AC at different speeds. Models with low consumption in ideal conditions are more affected in percentage terms.
| Model | Range Reduction 2kW at 46.5 kph / 28.9 mph | Range Reduction 2kW at 80 kph / 49.7 mph | Range Reduction 2kW at 120 kph / 75 mph |
|---|---|---|---|
| Tesla Model Y Long Range | -22.8% | -12.9% | -7.9% |
| Toyota bZ4X FWD | -27.7% | -11.6% | -7% |
| Audi Q8 e-tron 55 | -19.5% | -10% | -6.3% |
Internal Resistance in the Battery
When the temperature drops low enough, the electrolyte fluid in the battery becomes more viscous, slowing down chemical reactions and reducing electron flow. This increased internal resistance causes more heat loss and reduces the usable energy you can draw from the battery, potentially reducing the usable battery capacity by several kWh.
This effect impacts not only the range an EV can achieve on a charge but also how quickly it can recharge. As chemical reactions slow down, manufacturers program the battery to accept less power during charging.
To mitigate this, modern EVs have battery heating and cooling systems that maintain an optimal temperature range for the battery pack, usually between 40 and 115 degrees Fahrenheit. Many models support preconditioning the battery before charging.
However, these systems also consume some battery power, especially when heating the battery in cold weather. For example, if you have a battery with a 77 kWh net capacity and internal resistance reduces the usable capacity to 72 kWh, the range is reduced by 6.5% before factoring in increased consumption.
Air Density
Cold air is denser, resulting in higher aerodynamic drag.
Driving Style
As a driver, you can significantly improve the range by adopting efficient driving habits:
- Look ahead and coast as much as possible.
- When needing to reduce speed, do so early enough to use only recuperation.
How Does the Range Indicator Work?
Most EVs have a range indicator showing how many miles or kilometers the car can travel before the battery is empty. This range indicator works differently across brands.
Range Indicator Based on Rated Range and SOC
This type of range indicator bases the range on the rated range and the battery's state of charge (SOC). For example, if the rated range is 300 miles and the SOC is 50%, the car will indicate a range of 150 miles. It does not consider driving history or environmental factors, showing the same range in winter and summer regardless of driving style.
This type of range indication can be misleading, providing a false promise of the range. Tesla uses this type of range indicator and has faced criticism for it.
Range Indicator Based on Driving History and Environment
Many EV manufacturers use range indicators that estimate range based on driving history and environmental factors. These indicators typically learn from previous trips, which can cause variations in the displayed range.
The range indicator bases its estimate on the following data:
- Average consumption over the previous distance driven (typically the last 100 km)
- Outside temperature
- State of charge (SOC)
- Planned route in the navigation system
For example, if you have an e-tron 55 with an 86.5 kWh battery charged to 100%, the range indicator (often called a "guessometer" or GOM) will calculate the range based on your average consumption. If your average consumption was 25 kWh/100 km on previous trips, the range would be 346 km. If it was 20 kWh/100 km, the range would be 432 km. If it was 30 kWh/100 km, the range would be 288 km.
However, this estimate is based on past trips. If you change your driving behavior, the calculated range may be inaccurate. For instance, if you have done many short trips in cold weather, the average consumption will be high due to heating. This average is irrelevant for a long drive the next day, leading to an underestimated range.
If you have defined a route in the car's navigation system, the car will adjust the range based on elevation and the road ahead.

