
EV Information Design
EV information design is how an electric vehicle presents battery and energy information to the driver. It covers state of charge, estimated range, consumption, regeneration, charging status, battery temperature, preconditioning, power limits, and expected battery level at arrival.
This information is more important in an EV than many buyers realize. In a combustion vehicle, the fuel gauge is usually enough for daily use. In an EV, the driver often needs a better understanding of how much energy is available, how much the trip will use, whether the selected charger makes sense, and why the car behaves differently in cold weather, at high speed, or at a high battery percentage.
Good EV information design is not about showing as much data as possible. It is about turning battery and energy data into confidence.
Why EV Information Design Matters
An EV can be mechanically simple to drive, but the energy system behind it is dynamic. Range and charging speed are affected by temperature, speed, elevation, wind, road conditions, driving style, wheel size, towing, climate use, and battery temperature.
The driver does not need to understand every technical detail. The interface should translate these factors into useful information.
A strong EV interface answers the questions drivers actually have:
- How much battery do I have?
- Can I reach my destination?
- How much battery will I arrive with?
- Do I need to charge?
- Why has the range changed?
- Why is charging slower than expected?
- Is the battery ready for fast charging?
When this information is clear, the EV feels predictable. When it is missing or vague, even a technically capable vehicle can feel stressful.
State of Charge: The Number EV Drivers Trust
State of charge, usually shown as a percentage, is the most important battery value in an EV. It tells the driver how full the battery is.
Battery percentage should be treated as a primary value, not hidden behind a range estimate. Range is a prediction. State of charge is the reference point.
For experienced EV drivers, percentage often becomes more important than estimated range. They learn what 80%, 50%, or 20% means in normal use, just as combustion-car drivers learn how far they can drive on a quarter tank.
A good interface should make state of charge visible in the driver display, center display, and mobile app. It should also show it during charging, navigation, and remote vehicle checks.
The best systems combine battery percentage with context. For example:
- 78% battery
- 410 km estimated range
- 18% expected at destination
- 10% minimum arrival buffer
The percentage shows what is left. The other values explain what that means for the trip.
Range: Useful, But Often Misunderstood
Estimated range is one of the most visible EV numbers, but it is also one of the easiest to misinterpret.
Range is not a promise. It is a prediction based on assumptions. Those assumptions may be based on official test-cycle efficiency, recent driving, active navigation, weather, elevation, traffic, or a combination of these factors.
This is why range can change quickly. A car may show a high estimate after slow city driving and a much lower estimate after fast highway driving. Cold weather can reduce the estimate further because the battery and cabin need heat. A roof box, trailer, rain, snow, or large wheels can also increase consumption.
A good interface should not simply change the number and leave the driver guessing. It should explain the reason when the change is significant.
Useful explanations include:
- Range reduced due to low temperature
- Higher speed is increasing consumption
- Cabin heating is using additional energy
- Route includes significant elevation gain
- Trailer mode active
- Battery preconditioning active
These messages do not need to appear constantly. But when the range estimate changes in a way the driver may notice, the system should make the cause understandable.
The best range display is not the most optimistic one. It is the one the driver learns to trust.
Arrival Battery: The Most Useful Road-Trip Number
On longer journeys, estimated total range becomes less important than expected battery level at arrival.
If the driver enters a destination, the EV should show the predicted state of charge at the destination. If the route includes charging stops, it should show the expected battery level at each charger and at the final destination.
Example:
- Arrive at charger: 14%
- Charge to: 62%
- Arrive at destination: 21%
This is far more useful than only showing “range: 380 km.” The driver does not need to calculate whether the route is possible. The vehicle should do that work.
Arrival battery should be easy to see, especially during EV route planning. It should update if conditions change, such as speed, weather, traffic, elevation, or charger availability.
A mature EV navigation system should also give the driver useful choices when the margin becomes low. It should not simply warn that the battery is low. It should suggest a solution:
- Add a charging stop
- Reduce speed to increase arrival battery
- Choose a more efficient route
- Charge longer at the next stop
- Select an alternative charger
- Reduce energy use if needed
This is where EV information design becomes more than display design. It becomes decision support.
Battery Buffer and Driver Confidence
Many drivers do not want to arrive with 2% battery, even if the car predicts it is technically possible. A good interface should respect that.
A useful EV route planner should allow the driver to set a preferred arrival buffer. Some drivers may be comfortable arriving with 10%. Others may prefer 20%, especially in winter, in remote areas, when towing, or when arriving at a destination without reliable charging.
The interface should make the buffer visible without creating unnecessary anxiety. A simple color or status system can work well:
- Comfortable arrival margin
- Low margin
- Charging stop recommended
The important point is that the driver should understand the margin before it becomes a problem.
Consumption: Explaining Where the Energy Goes
Energy consumption explains range. The battery stores energy, and consumption determines how far that energy can take the vehicle.
Most EVs show consumption as kWh/100 km, Wh/km, miles/kWh, or kWh/100 miles, depending on the market. The exact unit matters less than consistency and clarity.
The interface should make it easy to see:
- Current trip consumption
- Average consumption
- Consumption since last charge
- Long-term consumption
- Route-based consumption
- Energy recovered through regeneration
- Energy used by climate control
Current consumption can be interesting, but it changes quickly and can become distracting. Average consumption is often more useful because it helps the driver understand real-world efficiency over time.
The best systems do not only show a number. They help explain what is driving the number. Highway speed, low temperature, strong wind, rain, snow, roof loads, towing, and aggressive acceleration can all raise consumption. Gentle city driving and effective regeneration can lower it.
A good interface helps the driver see these patterns without turning every journey into an efficiency lesson.
Consumption Units
Different regions use different EV consumption units.
Common examples include:
- kWh/100 km
- Wh/km
- miles/kWh
- kWh/100 miles
This can confuse new EV drivers because some units work in opposite directions. With kWh/100 km, a lower number is better. With miles/kWh, a higher number is better.
The vehicle should use the expected unit for the market, but ideally allow the user to change it. The interface should also avoid mixing units in a way that makes comparisons harder.
For EVKX readers comparing models across markets, this is especially important. Two vehicles may look different on paper simply because the consumption unit is presented differently.
Energy Flow Displays
Many EVs include an energy flow view showing energy moving between the battery, motors, wheels, and sometimes climate systems.
These displays can be useful because they help drivers understand how the EV works. They can show when the motor is using battery energy, when regeneration is sending energy back, and how front and rear motors are being used in all-wheel-drive models.
However, energy flow graphics are usually educational rather than essential. They are helpful when parked, when learning the vehicle, or when exploring the energy menu. They should not dominate the main driving display.
The driver does not need animated arrows all the time. The driver needs to know whether the vehicle is using energy, recovering energy, or limiting power or regeneration.
Power and Regeneration Meter
Many EVs replace the traditional tachometer with a power and regeneration meter. This shows how much power the vehicle is using during acceleration and how much energy it is recovering during deceleration.
This can be one of the most useful EV-specific display elements. It connects driving behavior directly to energy use.
A good power meter should make it clear when the vehicle is:
- Accelerating efficiently
- Using high power
- Coasting
- Regenerating
- Limiting regeneration
- Limiting available power
This is especially important in vehicles with one-pedal driving or adjustable regeneration. The driver should understand how the car will slow down when lifting off the accelerator.
If regeneration is reduced, the car should explain why. This can happen when the battery is cold, nearly full, or when traction is limited. A vague “regen limited” icon is less useful than a plain explanation.
For example:
Regeneration limited because the battery is nearly full.
That message helps the driver understand why the car feels different.
Battery Temperature and Charging Readiness
Battery temperature is one of the most important EV variables, but it is often hidden from the driver.
The temperature of the high-voltage battery affects fast charging speed, regeneration, power output, efficiency, and battery protection. A cold battery may charge slowly. A hot battery may reduce power. A battery near 100% may accept less regeneration.
Most drivers do not need to know the exact battery temperature in degrees. What they need to know is whether the battery is ready for the next task.
A better interface uses practical status messages:
- Battery cold: fast charging may be reduced
- Battery warming for fast charging
- Battery ready for fast charging
- Battery hot: performance may be limited
- Regeneration limited due to battery temperature
Advanced users may appreciate exact battery temperature in a detailed energy screen, but the primary interface should translate temperature into meaning.
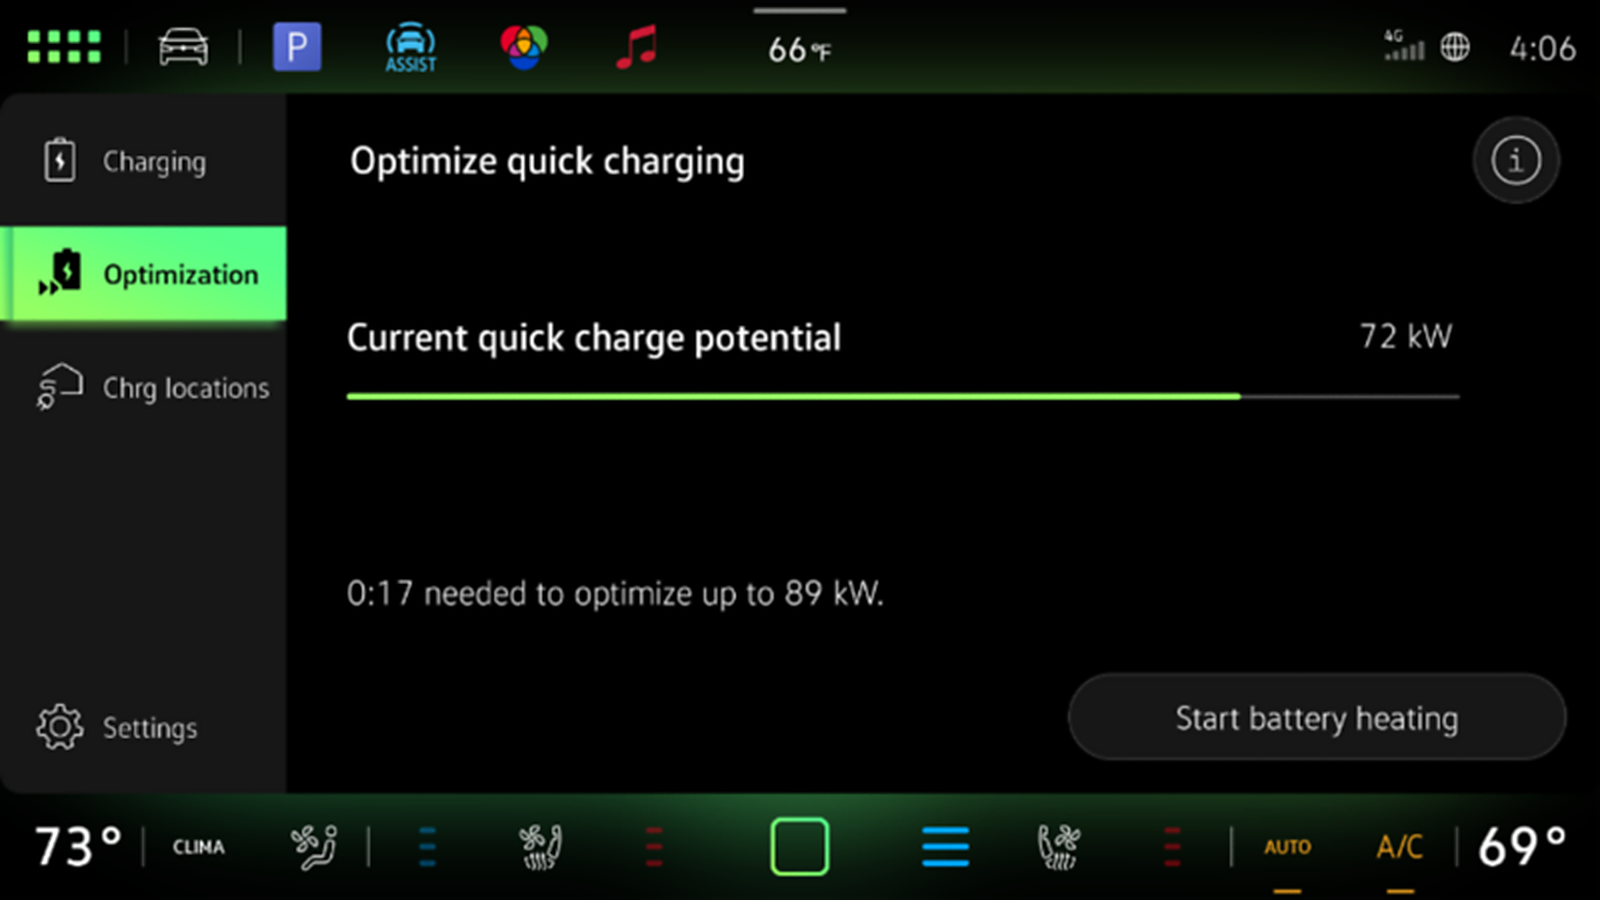
Battery Preconditioning
Battery preconditioning prepares the battery for fast charging or demanding driving. In cold weather, the battery may need heating before it can accept high charging power. In hot conditions, it may need cooling.
This is one of the areas where many EV interfaces still need improvement.
If the driver navigates to a fast charger, the car should clearly show whether preconditioning has started. The driver should not have to guess.
Useful messages include:
- Battery preconditioning active for fast charging
- Battery will be ready at arrival
- Battery warming may increase consumption before charging
- Preconditioning complete
- Preconditioning unavailable because no fast charger is selected
This matters because preconditioning can use energy before arrival, but it may reduce the total travel time by enabling faster charging. The interface should explain that trade-off.
A driver who sees range drop during preconditioning may think something is wrong. A driver who sees “Battery warming for faster charging” understands what is happening.
Charging Information
Few things frustrate new EV owners more than plugging into a high-power charger and seeing much lower charging power than expected. A car connected to a 250 kW charger may charge at 60 kW because the battery is cold, the state of charge is high, the charger is sharing power, or the vehicle has reached a battery protection limit.
The interface should explain this clearly.
During charging, the most useful information is:
- Current battery percentage
- Current charging power
- Time to selected charge limit
- Time to 80%, where relevant
- Added energy
- Added range estimate
- Charge limit
- Charging cost, where available
- Session status
- Expected completion time
The interface should not focus only on time to 100%. For daily use, time to the selected charge limit is more relevant. On road trips, the most useful value is often time until the car has enough energy to continue.
Charging is not linear. Most EVs charge fastest at a lower state of charge and slower as the battery fills. A good interface should make this easy to understand, especially for new owners.
For example:
Charging speed reduced because the battery is above 80%.
That is much better than letting the driver assume the charger or vehicle is broken.
Charge Limits
Charge limits are part of everyday EV use. Many drivers charge to a lower level for daily driving and use 100% before longer trips.
The interface should make this simple. Setting a charge limit should not require digging through several menus.
A good charge-limit interface should support:
- Daily charging limit
- Trip charging to 100%
- Departure time
- Scheduled charging
- Low-cost electricity windows
- Cabin preconditioning while plugged in
The vehicle should also explain recommendations in plain language. For example:
80% is recommended for daily charging. Use 100% before longer trips.
The exact recommendation depends on the battery chemistry and manufacturer strategy, so the interface should follow the guidance for that specific vehicle.
Route-Based Energy Prediction
The strongest EV information systems connect battery prediction with navigation.
A simple range estimate is useful, but route-based prediction is much better. A 100 km city route, a 100 km highway route, and a 100 km mountain route can require very different amounts of energy.
When a destination is active, the vehicle can estimate energy use based on:
- Distance
- Road type
- Speed limits
- Traffic
- Elevation
- Temperature
- Weather
- Wind, where available
- Driving history
- Vehicle load
- Trailer mode
- Climate settings
This allows the interface to show expected battery level at arrival and recommend charging stops when needed.
The best systems update the prediction during the trip. If the driver drives faster than expected, meets bad weather, or changes route, the arrival battery should update and the car should explain what changed if the impact is significant.
Speed and Range Feedback
Speed has a major effect on EV consumption, especially on highways. Air resistance rises sharply at higher speed, so small speed changes can make a noticeable difference.
A useful interface can turn this into practical guidance.
For example:
Reduce speed to 110 km/h to arrive with 15% battery instead of 9%.
This is more helpful than a generic eco message. It connects the action to a result.
The car should use this kind of advice selectively. Constant efficiency warnings can become irritating. But when the battery margin is low or the driver is trying to avoid a charging stop, speed-based feedback can be very useful.
Climate Energy
Climate control affects EV energy use, especially in very cold or hot weather. Heating the cabin, cooling the cabin, defrosting, and battery thermal management can all use energy.
The interface should make this visible without making comfort feel like a mistake.
Useful climate energy information includes:
- Estimated range impact from climate settings
- Energy used by heating or cooling
- Cabin preconditioning status
- Seat heating and steering wheel heating suggestions
- Eco climate mode
- Defrost status
- Heat pump operation, where relevant
A good interface informs rather than lectures. The goal is not to discourage heating or cooling. Comfort and safety matter. The goal is to help the driver understand the trade-off.
For example:
Using seat heating and lowering cabin temperature slightly may improve efficiency.
This is better than simply warning that climate use reduces range.
Reduced Regeneration and Power Limits
EVs sometimes change behavior to protect the battery or drivetrain. The vehicle may reduce regeneration, limit power, or reduce charging speed.
These changes can be normal, but they must be communicated clearly.
Regeneration may be reduced because:
- The battery is cold
- The battery is nearly full
- Road grip is limited
- Stability control is active
- The battery system is protecting itself
Power may be limited because:
- State of charge is low
- Battery temperature is too high
- Battery temperature is too low
- The vehicle has been used hard repeatedly
- A system fault is present
The driver should understand whether the limitation is temporary, expected, or a service issue.
A weak message says:
Power limited.
A better message says:
Power limited because the battery is cold. Full power will return as the battery warms.
That kind of explanation makes the vehicle feel predictable instead of faulty.
Warning Messages That Actually Help
EVs often need to explain invisible states. The driver cannot see battery temperature, charger communication, software status, or thermal protection. That makes warning messages especially important.
A poor warning tells the driver that something failed. A good warning tells the driver what happened, why it happened, and what to do next.
Examples:
Poor:
Charging unavailable.
Better:
Charging stopped because the connector is not locked. Remove and reconnect the cable.
Poor:
Regeneration limited.
Better:
Regeneration limited because the battery is nearly full. Brake pedal operation is unchanged.
Poor:
Fast charging reduced.
Better:
Fast charging reduced because the battery is cold. Battery heating is active.
Useful EV warnings should answer:
- What happened?
- Why did it happen?
- What should the driver do?
- Is it safe to continue?
- Is service required?
This is one of the simplest ways to improve EV ownership satisfaction.
Where the Information Should Appear
Not all EV information belongs in the same place. Good information design uses the right display for the right level of urgency.
Head-up display
The head-up display should be reserved for high-priority driving information. It can show speed, speed limits, navigation instructions, driver assistance alerts, and critical warnings.
It should not become a second infotainment screen.
Driver display
The driver display should show the information needed while driving:
- Speed
- State of charge
- Estimated range
- Power and regeneration
- Navigation guidance
- Arrival battery
- Driver assistance status
- Important warnings
This display should remain calm and readable. Too much animation or too many icons can reduce clarity.
Center display
The center display is best for deeper information and interaction:
- Full navigation map
- Charging plan
- Energy consumption graphs
- Charging settings
- Charge limits
- Climate details
- Vehicle settings
- Charging station information
The center screen can show more detail because it is not the primary driving display.
Mobile app
The mobile app is best for parked and remote tasks:
- Battery status
- Charging status
- Charge limit
- Charging schedule
- Cabin preconditioning
- Charging notifications
- Vehicle location
- Route planning
- Digital key status
The app must show whether its information is current. An outdated battery or charging status can be worse than no information.
Context Matters
The best EV interfaces change emphasis depending on the situation.
During a normal commute, the driver may only need battery percentage, speed, navigation, and climate. On a road trip, arrival battery and charging stops become more important. When approaching a fast charger, battery preconditioning and charger readiness matter. During charging, charging power and time to target become the focus.
The interface should not show everything all the time. It should show what matters now.
Examples:
Approaching a charger
The system should highlight:
- Arrival battery
- Charger location
- Charger availability
- Battery preconditioning status
- Expected charging power
- Backup chargers
During charging
The system should highlight:
- Current charging power
- Battery percentage
- Time to charge limit
- Session status
- Cost, where available
- Departure readiness
Low battery
The system should offer options:
- Add charging stop
- Reduce speed
- Select eco route
- Lower energy use
- Navigate to nearest suitable charger
This is where context-aware information becomes powerful. It reduces clutter and helps the driver make the next correct decision.
Avoiding Data Overload
EVs can produce a lot of data, but more information is not always better.
A poor interface turns the car into a dashboard of numbers. It shows too many graphs, icons, warnings, animations, and menus at once. That may appeal to a few enthusiasts, but it can overwhelm normal drivers.
A better approach is layered information:
- Show essential information by default.
- Add detail when it is useful.
- Explain changes when they matter.
- Keep advanced data available for users who want it.
For example, most drivers need to know that the battery is ready for fast charging. A smaller group may want exact battery temperature. Both can be supported, but they should not be forced into the same main display.
The goal is not less information. The goal is better hierarchy.
Trust and Transparency
Trust is the real test of EV information design.
Drivers trust an EV when the car’s predictions are realistic and when changes are explained. They lose trust when range drops without explanation, charging is slower than expected, regeneration changes unexpectedly, or the app shows stale information.
A trustworthy interface does four things well:
- It predicts accurately enough for real use.
- It explains important changes.
- It gives the driver useful options.
- It avoids hiding important EV states.
For example, adding a charging stop without explanation can feel annoying. Adding a charging stop and showing that the arrival battery would otherwise fall below the preferred buffer feels intelligent.
The difference is not the feature. It is the communication.
Supporting New and Experienced EV Drivers
EV interfaces need to work for both first-time EV drivers and experienced owners.
New drivers may need simple explanations:
- What state of charge means
- Why range changes
- Why charging slows after 80%
- Why preconditioning matters
- Why regeneration is sometimes limited
- How to set a charge limit
Experienced drivers may want deeper information:
- Consumption trends
- Charging curve behavior
- Battery temperature
- Energy recovered
- Route energy prediction
- Power and regeneration limits
The best systems use progressive disclosure. They keep the default view simple, but allow deeper information when the user wants it.
Common Mistakes
Many EVs still make basic information-design mistakes.
Common problems include:
- Hiding battery percentage
- Showing only estimated range
- Not showing arrival battery during navigation
- Using optimistic range estimates without context
- Not explaining why range changed
- Hiding battery preconditioning status
- Not explaining slow fast charging
- Making charge limits hard to adjust
- Using vague charging error messages
- Showing too much data in the driver display
- Using unclear icons for regeneration or battery status
- Failing to explain reduced regeneration
- Showing outdated status in the mobile app
These issues may not be obvious during a short test drive, but they matter over months and years of ownership.
What Buyers Should Check
When evaluating an EV, buyers should look beyond screen size and graphics. The question is not whether the display looks modern. The question is whether it helps the driver understand and use the EV.
Useful checks include:
- Is battery percentage always visible?
- Is estimated range shown with useful context?
- Does navigation show expected battery at arrival?
- Does the route planner add charging stops automatically?
- Does it show battery preconditioning status?
- Does it explain slow charging?
- Can charge limits be adjusted easily?
- Is consumption easy to understand?
- Does the vehicle show regeneration status?
- Does it explain reduced regeneration?
- Are charging errors specific and useful?
- Does the mobile app show current battery and charging status?
- Does the interface remain calm and readable while driving?
A good EV should make the driver feel informed, not dependent on guesswork.
Summary
EV information design is one of the most important parts of the electric vehicle experience. It determines how well the driver understands battery state, range, consumption, charging, regeneration, and trip confidence.
The best systems do not simply display data. They interpret it. They show the right information at the right time, explain why conditions change, and help the driver make better decisions.
A clear state of charge display, realistic range estimate, reliable arrival battery prediction, visible preconditioning status, understandable charging information, and specific warning messages can make an EV much easier to live with.
In an EV, information design is not decoration. It is part of the vehicle’s usability, safety, and trust.