
Charging loss
Charging loss during high-power DC charging is the difference between the energy delivered by the charging station and the energy ultimately stored in the vehicle’s battery.
The difference does not normally indicate an inaccurate charger. Public DC chargers use regulated measuring systems for billing, but they measure the charging transaction—not the final amount of chemical energy stored in the battery cells.
Some energy becomes heat in cables, connections, vehicle hardware, and the battery itself. Some is deliberately consumed by battery heating, cooling, pumps, fans, control units, and other systems operating during the session.
In this article, charging loss includes both:
- physical losses that convert electrical energy into heat
- auxiliary energy used by the vehicle during charging
Auxiliary consumption is not necessarily wasted energy. Battery heating and cooling may be required for fast, safe, and repeatable charging. However, that energy is still not stored in the battery.
Calculating charging loss
Charging loss is normally expressed as a percentage:
Charging loss = (Energy delivered - Energy stored) / Energy delivered
If a charger delivers 70 kWh and the battery stores 66 kWh, the estimated charging loss is:
(70 kWh - 66 kWh) / 70 kWh = 5.7%
Charging efficiency is the inverse expression:
Charging efficiency = Energy stored / Energy delivered
In this example, charging efficiency is approximately 94.3%.
The difficulty is not the formula, but obtaining an accurate value for the energy actually stored in the battery.
What the charger measures
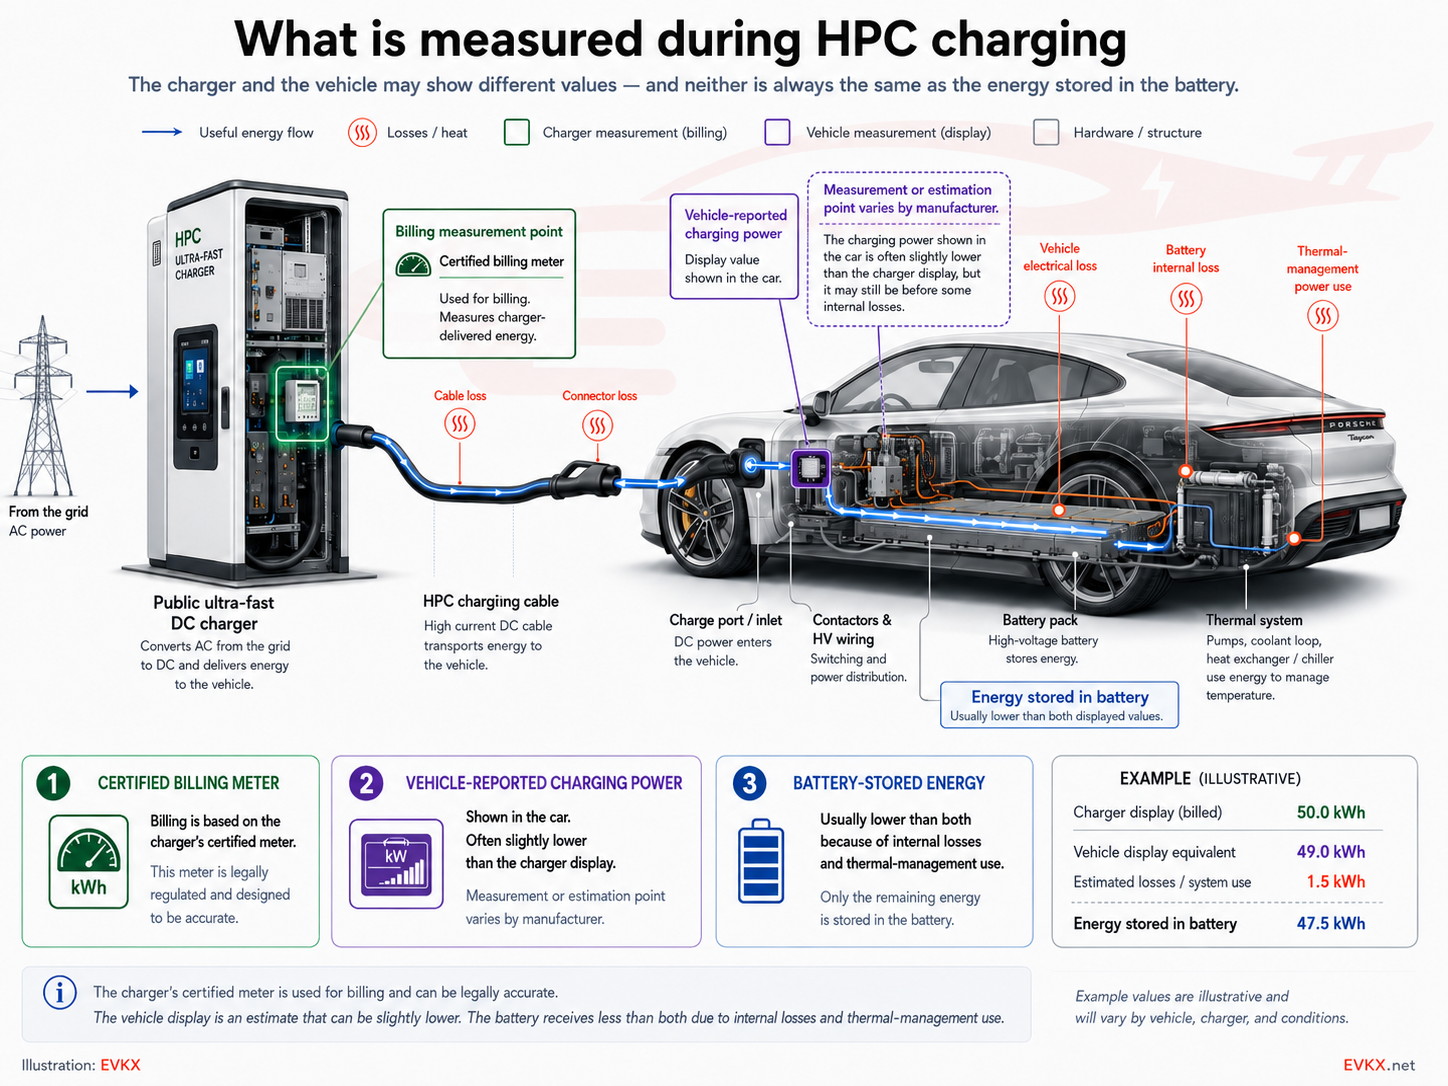
A public DC charger measures the electrical energy transferred during the charging session. This is the value used to calculate the bill and normally shown on the charger display or charging receipt.
It is important to separate four different values:
- Billed energy is measured by the charger in kWh.
- Charger power is the instantaneous charging rate reported by the charger in kW.
- Vehicle charging power is measured or estimated by the vehicle.
- Battery energy added normally has to be calculated from battery data or estimated from the change in state of charge.
The charger does not measure the final chemical energy stored inside the cells. A charging session can therefore be correctly metered while the battery stores fewer kilowatt-hours than the charger reports.
What the vehicle display shows
The charging power shown inside the car may be slightly lower than the power shown by the charger.
The charger and the vehicle use separate sensors and calculations. The charger measures according to its approved measuring system, while the vehicle calculates a value from measurements within its own high-voltage system.
The exact vehicle-side measurement point varies between manufacturers. Depending on the design, the displayed power could represent:
- power entering the vehicle
- power on the internal high-voltage bus
- power reaching the battery pack
- a value calculated by the battery management system
The number shown in the car should therefore not automatically be interpreted as net power being stored in the cells. Battery internal resistance, thermal-management consumption, low-voltage loads, and other losses may still occur outside or after the value represented on the display.
This explains why three different numbers can all be valid:
- the charger shows the highest power or energy
- the vehicle shows a slightly lower charging value
- the battery stores less energy than either value suggests
Legal metering and certification
Public charging equipment used for commercial billing is subject to legal metrology requirements. The principle is comparable to a fuel pump: the customer must be billed using a measuring system that remains within defined accuracy limits.
In the European Union, Directive (EU) 2026/706 amended the Measuring Instruments Directive to include measuring systems for electric vehicle charging equipment. It entered into force on 9 April 2026. Member states must transpose the requirements by April 2028 and apply their national measures from October 2028, with transitional provisions for equipment and certificates already on the market.
The directive defines the transfer point as the point where energy is transferred between the EVSE and the vehicle. Although the physical meter may be installed inside the charger cabinet, the approved EVSE measuring system must account for the energy delivered at the defined transfer point. Cable heat should therefore not simply be assumed to be fully added to the customer’s billed energy.
Internationally, OIML G 22 provides guidance covering the metrological and technical requirements for both AC and DC EVSE, including approval, verification, testing, metrological data, and complete measuring-system behaviour.
In the United States, NIST Handbook 44 includes specifications and accuracy tolerances for electric vehicle fueling systems. NIST also publishes test procedures for evaluating retail EV charging equipment against those requirements.
These rules ensure that the commercial transaction is measured fairly. They do not mean that every billed kilowatt-hour is stored in the vehicle battery.
Where charging loss occurs
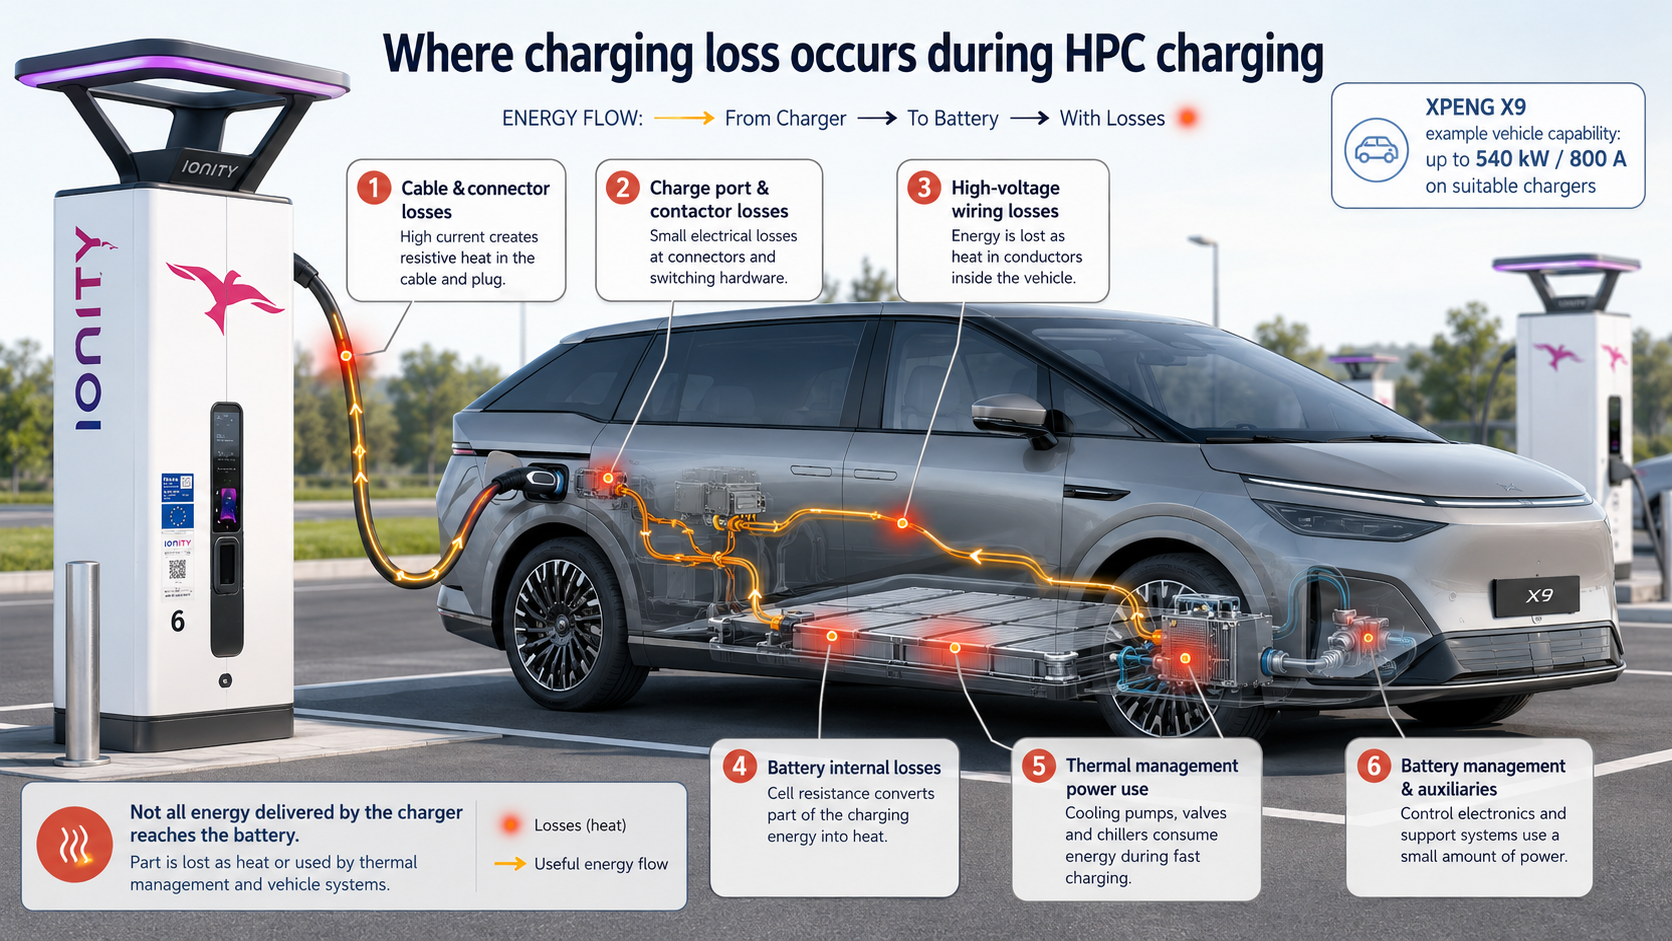
During HPC charging, the charging station converts grid AC into controlled DC power and supplies it to the vehicle’s high-voltage system. The vehicle’s onboard AC charger is bypassed, but several other loss and consumption points remain.
The main contributors are:
- cable and connector resistance
- vehicle inlet and contact resistance
- contactors, busbars, sensors, and high-voltage wiring
- voltage conversion where required
- internal resistance in the battery cells
- battery heating and cooling
- coolant pumps, fans, valves, and compressors
- battery management and other control electronics
- DC/DC supply for the low-voltage electrical system
Differences caused by SOC rounding or capacity estimates are not physical charging losses. They are sources of uncertainty when trying to calculate the loss from publicly available charging data.
Cable and connector losses
High current creates heat in conductors and electrical contacts. HPC cables are therefore often liquid-cooled, allowing them to carry several hundred amps without becoming excessively thick, heavy, or hot.
The physical energy meter can be located inside the charging cabinet, before the permanently attached cable. However, legal metrology considers the behaviour of the complete measuring system and its defined transfer point, not only the location of the meter component.
Cable and connector losses still matter technically. They affect thermal limits, cable cooling, charger efficiency, and the maximum current the equipment can sustain.
These losses become increasingly relevant at 500–800 amps. At such currents, small changes in contact resistance, conductor temperature, cable design, and connector cooling can materially affect heat generation.
Vehicle-side electrical losses
After entering the vehicle, the charging current passes through the inlet, contactors, current sensors, busbars, high-voltage wiring, and possibly voltage-conversion hardware before reaching the battery.
Every conductor and connection has some resistance. The resistance may be very low, but the current during HPC charging is high.
Electrical heating follows:
Power loss = Current² × Resistance
Because current is squared, doubling the current produces four times the resistive loss if resistance remains unchanged.
For an approximate comparison:
- 200 kW at 400 volts requires around 500 amps
- 200 kW at 800 volts requires around 250 amps
This is one reason higher-voltage architectures are useful for fast charging. They can deliver the same power at lower current, reducing resistive heating in cables, connectors, and high-voltage conductors.
Actual battery voltage changes with SOC and load, so “400-volt” and “800-volt” are architecture classes rather than fixed operating voltages.
Battery internal loss
Lithium-ion cells have internal resistance. When charging current passes through the cells, part of the incoming energy becomes heat rather than stored chemical energy.
Battery internal loss varies with:
- cell chemistry
- cell format and electrode design
- battery temperature
- charging current
- state of charge
- battery age
- manufacturer charging strategy
The loss is not constant throughout a charging session. Cells may generate more heat during high-current charging, while charging near full SOC uses lower current but takes longer.
If battery temperature rises beyond the preferred operating window, the vehicle reduces charging power or increases cooling effort. If the battery is too cold, the vehicle may use part of the incoming energy to heat it.
Two EVs with the same advertised peak charging power can therefore have different charging efficiency and thermal behaviour.
Thermal-management energy use
High-power charging is also a thermal-management process.
During a charging session, the vehicle may operate:
- coolant pumps
- radiator fans
- refrigerant compressor
- coolant valves
- battery chiller
- high-voltage heater
- heat pump
- battery and charging control units
These systems consume electrical energy, but their purpose is to keep the cells and charging hardware within an acceptable temperature range.
The refreshed Porsche Taycan illustrates the scale of the thermal system required for sustained HPC charging. Porsche specifies charging at up to 320 kW on suitable 800-volt equipment, with more than 300 kW available for up to five minutes under suitable conditions. Porsche has also stated that the revised battery cooling plate increased cooling capacity from 6 to 10 kW.
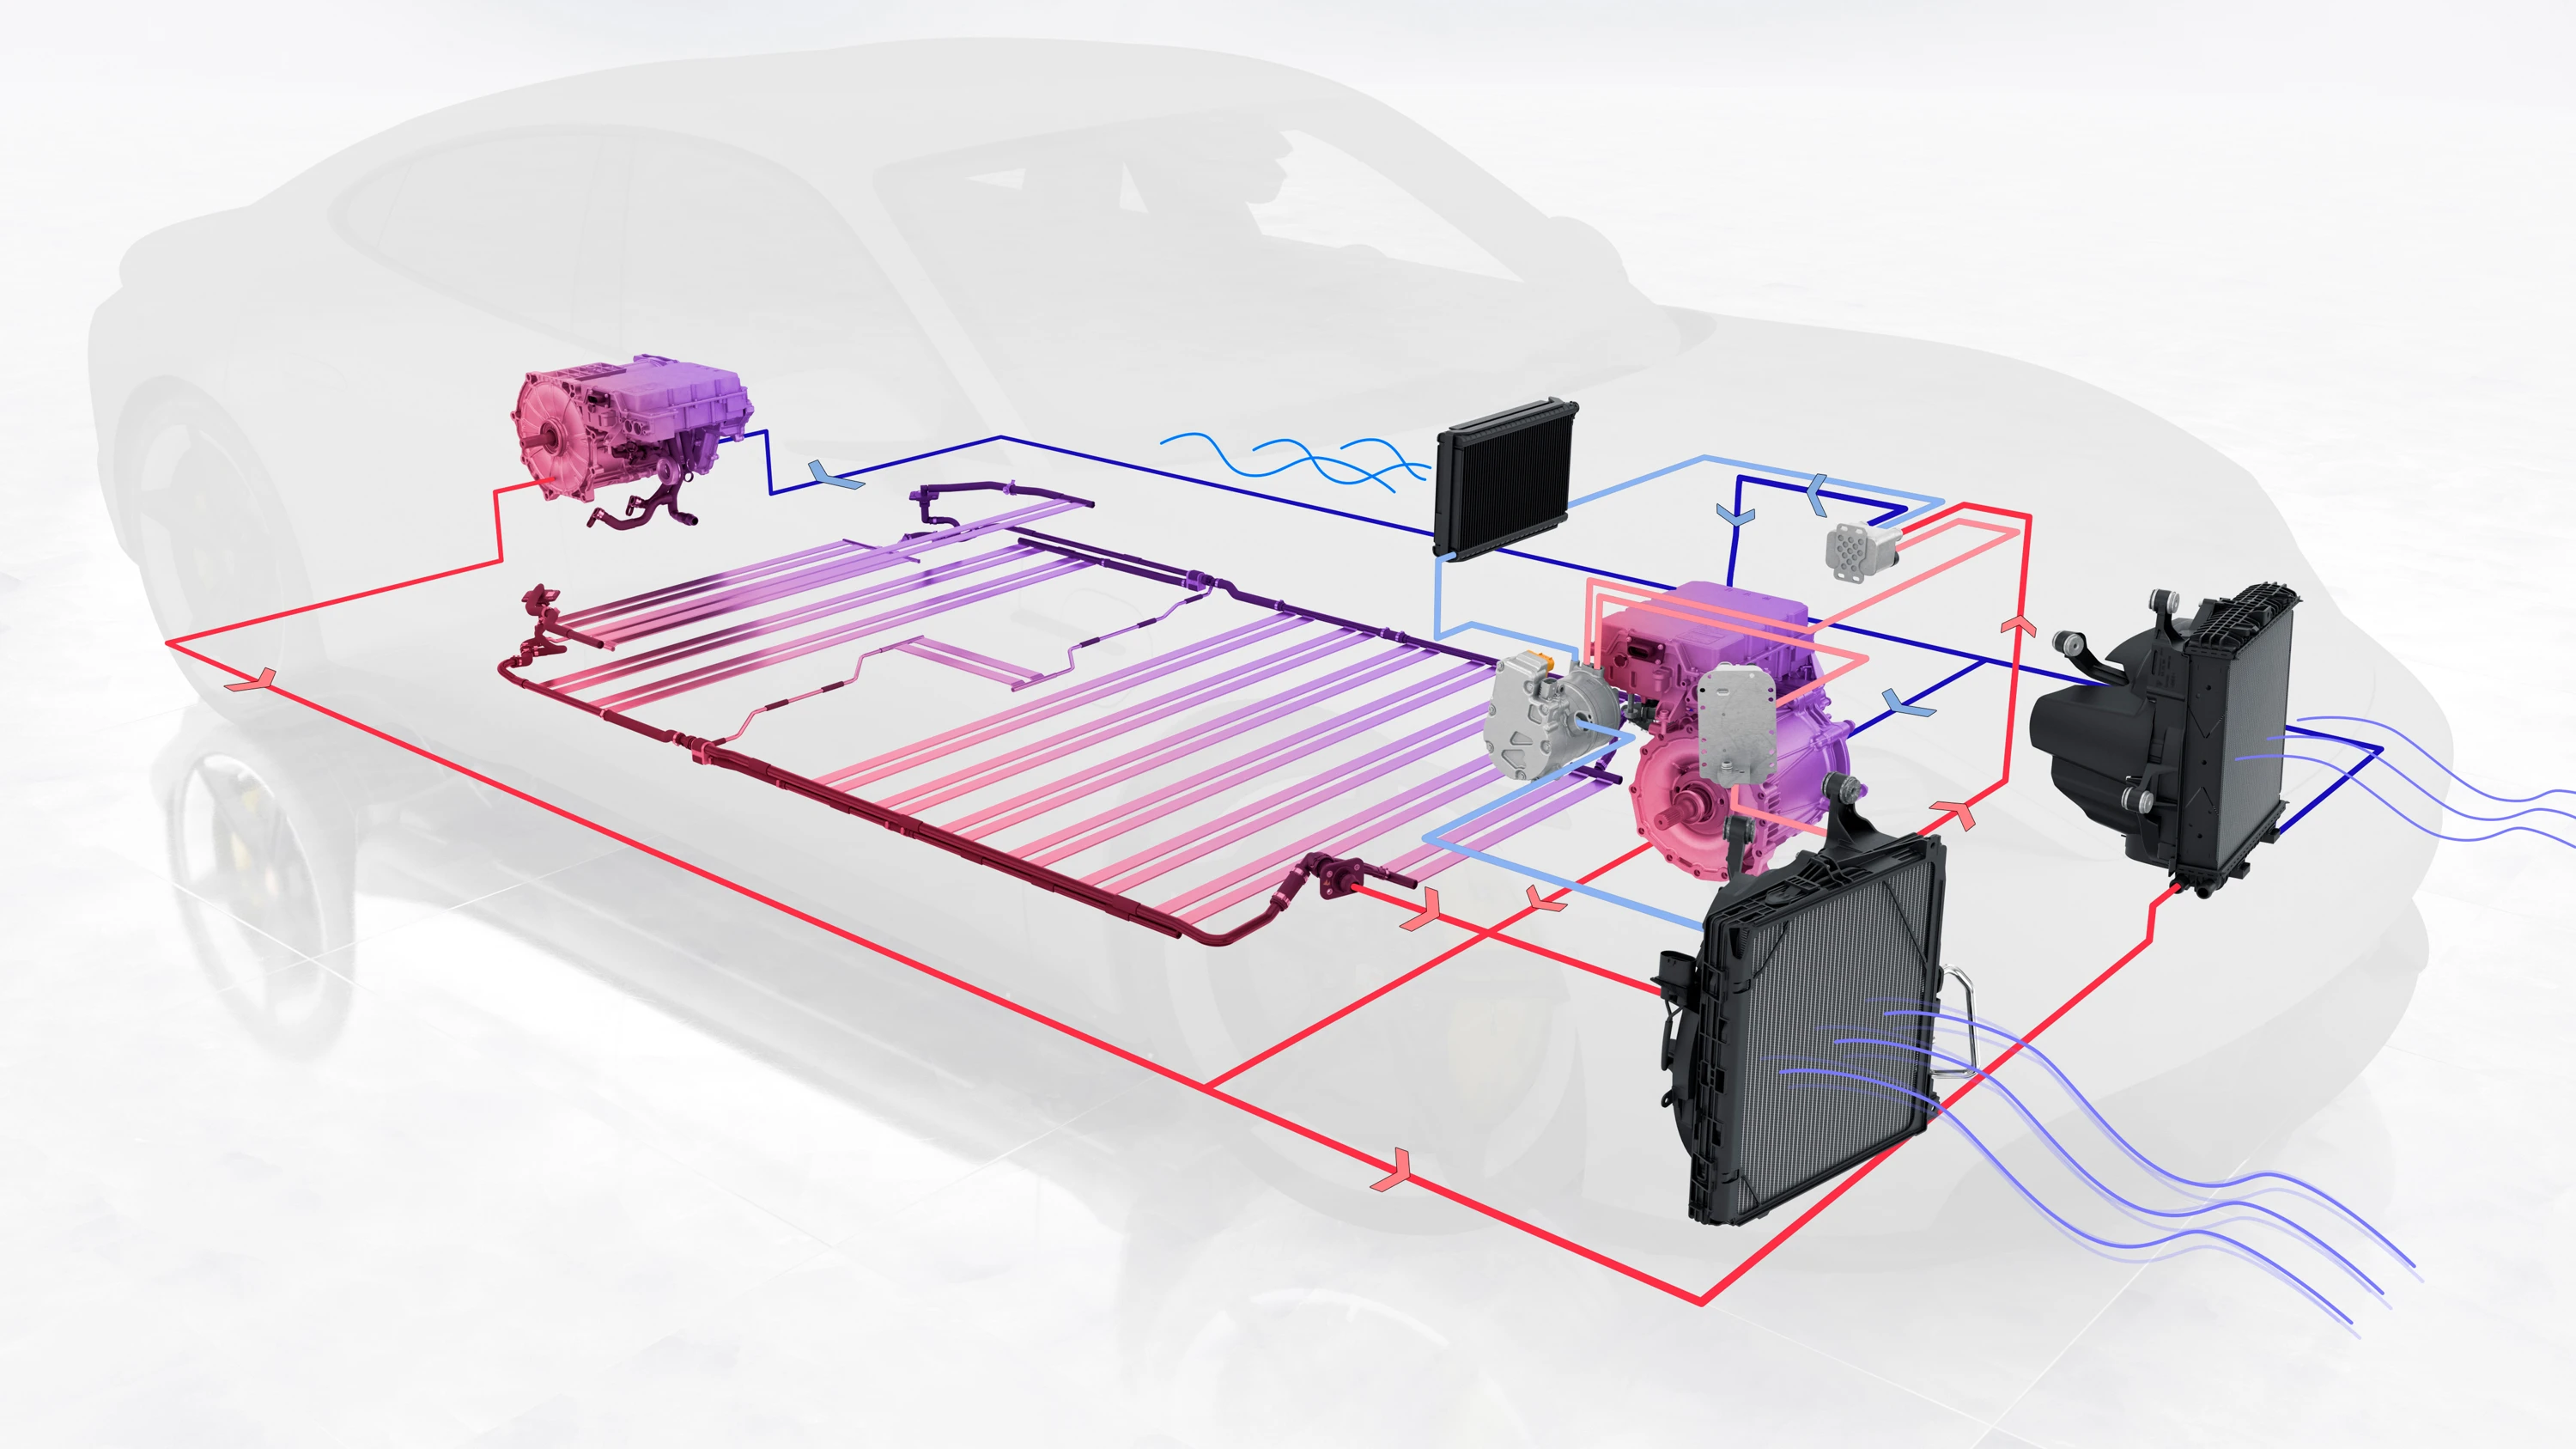
The 10 kW figure describes heat-removal capacity, not necessarily 10 kW of electrical consumption. A refrigerant cooling system can move more thermal energy than the electrical power consumed by its compressor, pumps, and fans.
Even so, the electrical energy used by the thermal system reduces the amount available for storage during the session. Its effect is relatively small while the battery is receiving more than 300 kW, but it becomes more significant as charging power tapers or when heating or cooling continues for an extended period.
How temperature affects charging loss
Cold battery
A cold battery generally cannot accept its maximum charging power. The vehicle may therefore heat the battery before arrival, during the charging session, or both.
When battery heating takes place while connected to the charger, part of the delivered energy is used by the heater and coolant system instead of increasing SOC.
This can make the effective difference between billed energy and battery energy added considerably larger than during a warm-weather session.
Route-based battery preconditioning can improve the result. The vehicle uses energy while driving to bring the battery toward its preferred charging temperature, allowing it to begin charging more quickly after arrival. Preconditioning does not make the heating energy free, but it changes when and where that energy is consumed.
Hot battery
A hot battery may require active cooling during charging. This can happen after:
- prolonged high-speed driving
- mountain driving
- repeated HPC sessions
- high ambient temperatures
- hard acceleration shortly before charging
The compressor, coolant pumps, and radiator fans may run at high output. If the thermal system cannot maintain the required cell temperature, the vehicle reduces charging power.
The driver may notice loud cooling fans, warm air leaving the vehicle, or a charging curve below the expected level.
How SOC affects charging loss
Charging loss is not constant across the charging curve.
At low and medium SOC, a warm battery may accept very high current. This produces more resistive heat in the cells and high-voltage components.
At higher SOC, charging power tapers and the current falls. Instantaneous resistive losses may then be lower, but the remaining session takes longer. Pumps, fans, control units, and other systems continue consuming power throughout that time.
Charging from 80 to 100% can therefore be relatively inefficient in terms of time and auxiliary energy, even though current is lower than during the high-power part of the session.
This is one reason 10–80% has become the most common range for comparing DC fast-charging performance.
Estimating battery energy from SOC
Charging tests often estimate stored energy from the SOC change and the vehicle’s stated usable battery capacity.
For example:
80 kWh usable capacity × 70% SOC increase = 56 kWh estimated battery energy added
If the charger reports 59 kWh during the same 10–80% session, the calculated loss would be:
(59 kWh - 56 kWh) / 59 kWh = 5.1%
This calculation is useful, but it is not a precise measurement.
Possible sources of uncertainty include:
- rounded SOC values
- non-linear SOC reporting
- unknown battery temperature
- usable capacity that changes with temperature
- top and bottom buffer management
- battery ageing
- BMS calibration
- auxiliary consumption during the session
- small timing differences between readings
For example, a displayed change from 10% to 80% does not prove that the battery gained exactly 70.00% of its current usable capacity.
Why a charging session cannot measure battery SOH
A public charging receipt cannot be used as a direct battery-capacity or state-of-health test.
Suppose an EV charges from 10% to 80%, and the charger reports 63 kWh delivered. Dividing 63 kWh by 70% would suggest a battery capacity of 90 kWh.
That conclusion would be unreliable because the 63 kWh includes more than the energy stored in the battery. It may also include:
- electrical and battery losses
- battery heating or cooling
- pumps, fans, and control systems
- energy supplied to the low-voltage system
- energy consumed while the vehicle remains awake
The SOC values introduce additional uncertainty through rounding, BMS estimation, temperature-dependent usable capacity, buffer management, and possible recalibration.
A single session therefore combines too many unknowns to isolate battery degradation.
Repeated sessions under similar conditions can reveal a broad trend, but they are still not equivalent to a controlled capacity test. Better sources for evaluating SOH include:
- battery management system data
- manufacturer diagnostic tools
- repeated controlled discharge and recharge tests
- measured battery current and voltage over a defined cycle
- long-term usable-capacity trends under comparable conditions
Even those methods must account for battery temperature, SOC calibration, and the manufacturer’s buffer strategy.
Charger kWh tells you how much energy the charger delivered. It does not directly reveal how much usable battery capacity remains.
How EVKX handles charging loss
EVKX charging curves are based on charger-side charging power. This reflects what the driver experiences at a public charger: delivered power, charging time, and energy supplied by the charger.
To convert charger-delivered energy into estimated battery energy, EVKX currently applies a flat 5% charging-loss assumption.
Estimated battery energy = Charger-delivered energy × 0.95
For example:
50 kWh × 0.95 = 47.5 kWh
EVKX would therefore estimate:
- 50 kWh delivered by the charger
- 2.5 kWh charging loss and auxiliary consumption
- 47.5 kWh stored in the battery
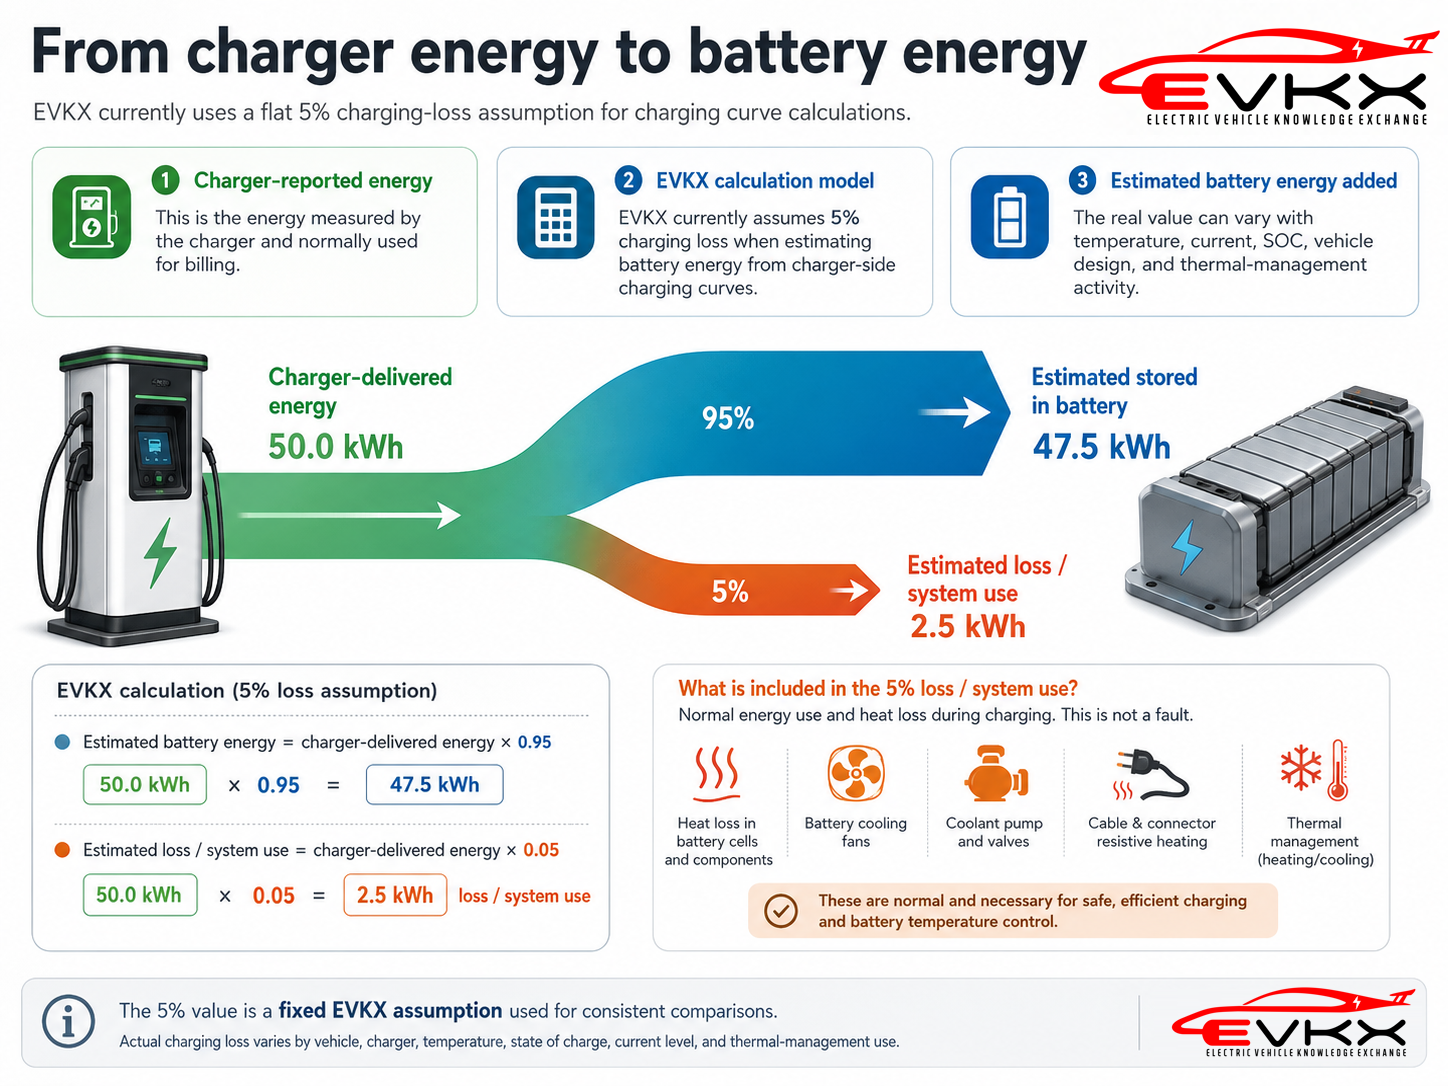
The 5% value is a calculation assumption, not a measured value for every vehicle or charging session.
Actual charging loss can be lower or higher depending on:
- battery and ambient temperature
- charging current
- state of charge
- battery chemistry and pack design
- cable and charging equipment
- thermal-management activity
- vehicle auxiliary consumption
Using one consistent assumption makes EVKX charging comparisons easier to reproduce across vehicles. The resulting values should be interpreted as comparative estimates, not laboratory measurements of battery energy.
The same limitation applies to calculated range added per minute. It depends on both estimated battery energy and an assumed consumption figure.
What charging loss means for drivers
Charging loss is normally noticed indirectly rather than as a separate value.
It can appear as:
- more kWh billed than expected from the SOC increase
- different power figures on the charger and vehicle displays
- increased energy use during winter charging
- loud cooling systems during hot-weather or repeated charging
- higher cost per usable kWh than the charger price alone suggests
Charging loss is only one part of the practical charging experience. For long-distance driving, charging curve shape, charger availability, battery preconditioning, reliability, and charging-stop duration are usually more noticeable.
For detailed charging comparisons, however, the distinction between delivered and stored energy is essential. A charger can be accurate and correctly bill the session while the battery stores less energy than the charger delivered.
Related terms
- High-Power Charging
- DC Fast Charging
- Charging Curve
- Battery Preconditioning
- Charging Efficiency
- State of Charge
- State of Health
- Usable Battery Capacity
- Battery Thermal Management
- Legal Metrology